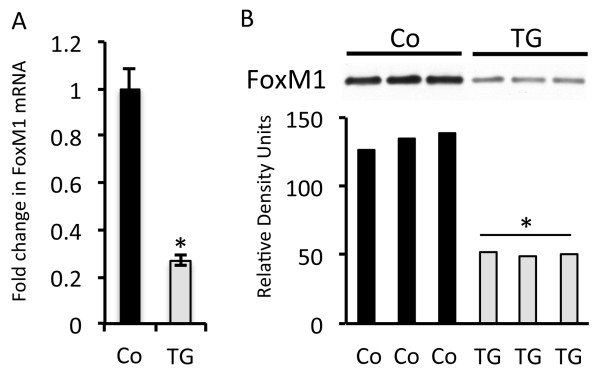
Figure 5.
FoxM1 expression in RAGE TG compared to controls. Quantitative RT-PCR (A) and immunoblotting (B)for FoxM1 using standardized aliquots of total lung mRNA or protein revealed markedly decreased FoxM1 expression in RAGE TG mouse lung compared to controls (Co). *Statistical difference (P ≤ 0.05) with at least three replicates per group.

