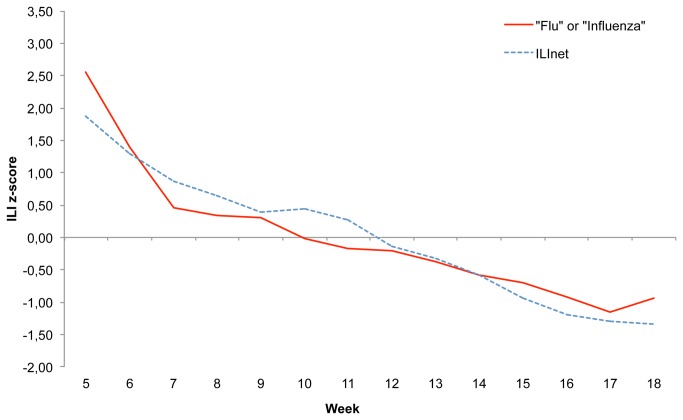
Figure 3. Weekly reported ILI (CDC) and tweets including the words “flu” or “influenza”.
The blue line represents in all graphs the z-scores of CDC’s reported ILI for the 14-week period starting in week 5 (January 2013) through week 18 (May 2013). The red line represents the z-scores of tweets including the words “flu” or “influenza”, geolocalized with the extended narrow localization pattern.

