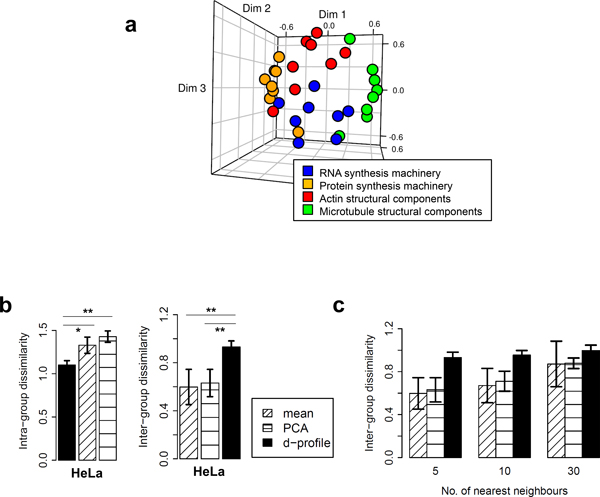
Figure 7.
Evaluation of phenotypic profiling. (a) Multidimensional scaling plot based on the cosine dissimilarities among the d-profiles for the 32 siRNAs, which are color-coded according to their known biological functions. (b) Mean intra- and inter-group dissimilarities of phenotypic profiles constructed for 32 siRNAs in the HeLa dataset based on mean-, principal-component-analysis-(PCA)-based, and "d-profiles" (error bars = SEM, * = P<0.05, ** = P<0.01, *** = <0.001; two-sided paired t-test.). (c) Inter-group dissimilarities of mean-, PCA-based and d-profiles for different numbers of nearest neighbors. (Error bars = SEM).

