
Figure 5.
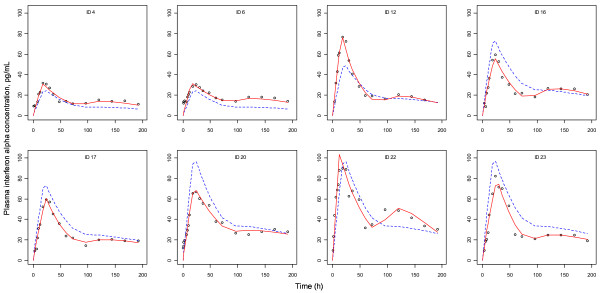
PK curves from representative individuals showing double peaks. Circle, observed value; dashed line, population predicted value; solid line, individual predicted value.
Official websites use .gov
A
.gov website belongs to an official
government organization in the United States.
Secure .gov websites use HTTPS
A lock (
) or https:// means you've safely
connected to the .gov website. Share sensitive
information only on official, secure websites.
PK curves from representative individuals showing double peaks. Circle, observed value; dashed line, population predicted value; solid line, individual predicted value.