
FIGURE 1.
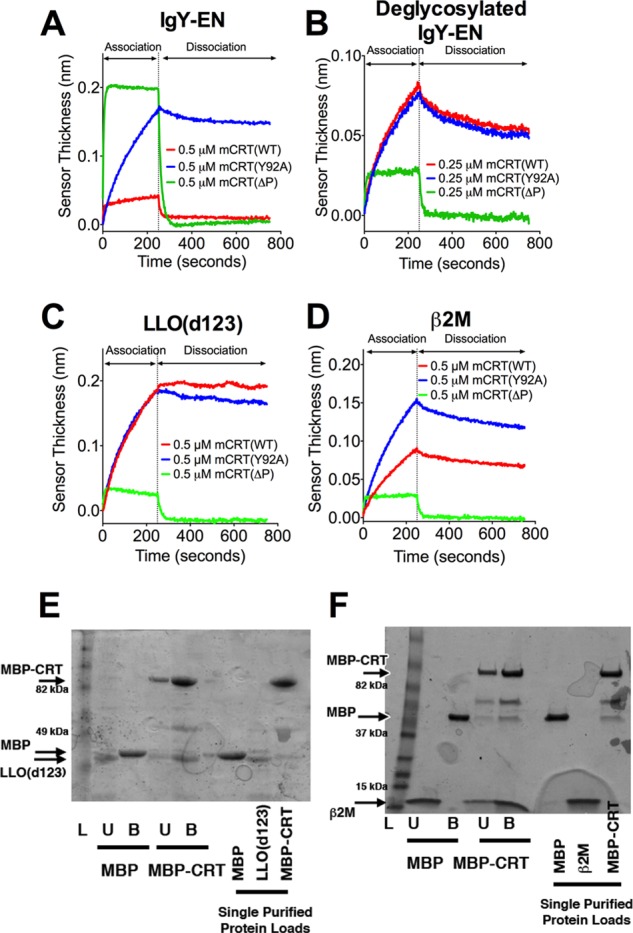
Distinct kinetic profiles characterize the interaction of calreticulin with glycosylated and nonglycosylated proteins. Representative BLI sensorgrams for the interaction between mCRT(WT), mCRT(ΔP), and mCRT(Y92A) with IgY enriched on a calreticulin affinity column (IgY-EN) (A), deglycosylated IgY-EN (B), LLO(d123) (C), or β2M (D). The associated kinetic rate constants and data replicates are detailed in Table 1. E and F, representative SDS-PAGE gels (of three independent experiments) depicting the binding of LLO(d123) (E) or β2M (F) to MBP or MBP-calreticulin (MBP-CRT) immobilized on an amylose resin. Lanes L, ladder; lanes U, amylose-resin unbound fraction; lanes B, amylose-resin bound fraction. Arrows depict migration positions of β2M, LLO(d123), MBP, and MBP-CRT. Interactions between MBP-CRT and LLO(d123) (E) were assessed using a 10% SDS-PAGE gel, whereas MBP-CRT binding to β2M (F) was assessed using a 4–20% gradient gel (Bio-Rad). MBP was found to migrate at a slightly reduced speed when analyzed on a gradient gel.