
FIGURE 4.
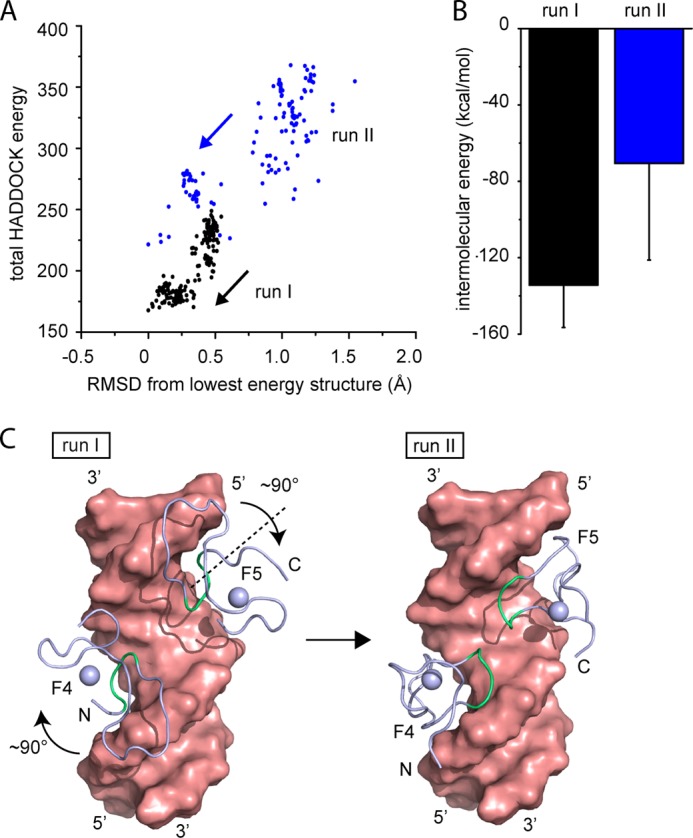
Data-driven structural modeling of F4F5-DNA interaction. A, graph showing total HADDOCK energy as a function of the RMSD to the lowest energy structure of two runs (run I and II) from HADDOCK docking of an F4F5 polypeptide to double-stranded RARE DNA (different starting orientations were used for each run). Significant convergence is observed in both runs. B, calculated intermolecular energy (using standard HADDOCK protocols) of the 10 best structures of each run. Error bars indicate ± S.E. C, space-filling representation of lowest energy structures from run I and II without the linker region between the ZFs. Residues colored in green are the DNA-binding residues.