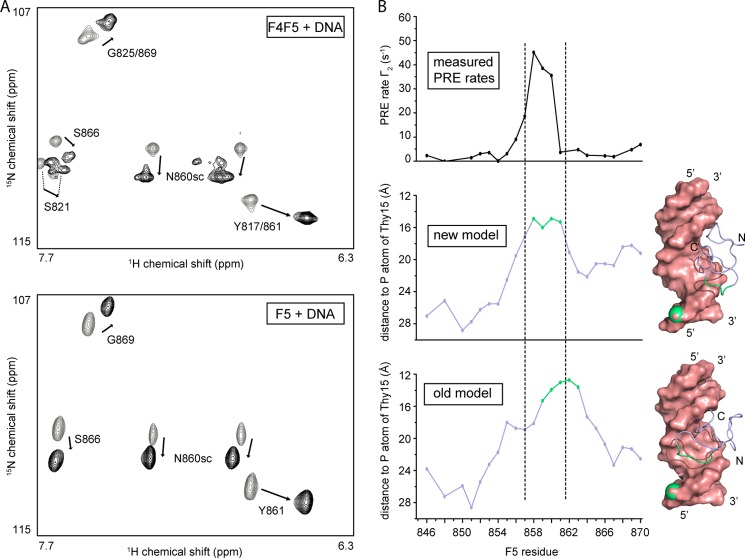
FIGURE 8.
Comparison to the single-finger F5-DNA interaction. A, portion of the 15N HSQC of 15N-labeled double ZF protein F4F5 (upper) and single ZF F5 (14) (lower), respectively, in the absence (gray) and presence (black) of 1 molar eq of RARE DNA. Note the similarity in both the magnitude and the direction of the chemical shift changes. B, semiquantitative PRE analysis of F5 in the presence of nitroxide spin-labeled RARE DNA. The PRE rate calculated from a two time point 15N HSQC experiment (25) is plotted as a function of the amino acid (upper part) and compared with the actual distance between the phosphorus atom of Thy15 (on which the PRE label is located) and the corresponding backbone HN proton for the two different F5-DNA models, respectively (middle and lower parts). The PRE rate profile agrees better with the distance profile of the new F5-DNA model than with that of our previous model (14). Residues colored in green are those with distances to the Thy15 phosphorus (in green as well) that are below the average distance minus one standard deviation. These residues are indicated on the corresponding model (right part of figure).

