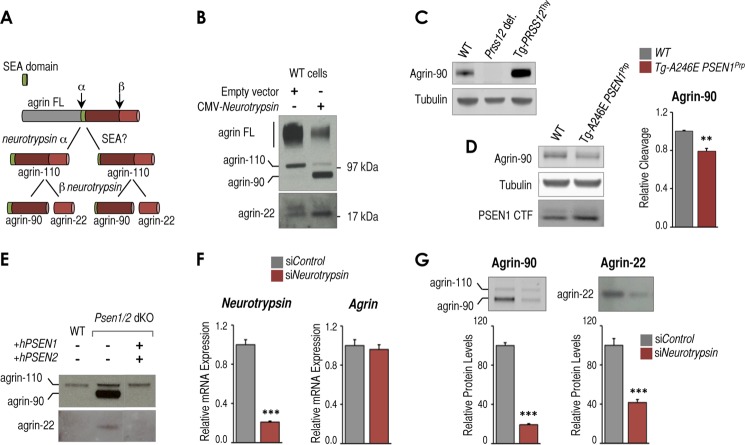
FIGURE 2.
Presenilin-dependent changes in neurotrypsin expression impact neurotrypsin-dependent cleavage of agrin. A, scheme of neurotrypsin-dependent and potential alternative neurotrypsin-independent and SEA-dependent agrin proteolytic fragmentation pathway. B, Western blot analysis of full-length agrin (agrin FL) and proteolytic fragments in conditioned medium from wild-type MEFs transfected with an empty CMV vector or CMV-neurotrypsin-expressing vector. Full-length agrin and agrin proteolytic fragments of ∼110 (agrin-110), ∼90 (agrin-90), and ∼22 kDa (agrin-22) are indicated. C, Western blot analysis showing agrin-90 and tubulin as a loading control in brain samples from wild-type (WT) mice, neurotrypsin-deficient mice (Prss12 def.), and mice overexpressing neurotrypsin (Tg-PRSS12Thy). D, left panel, Western blot analysis showing agrin-90, tubulin as loading control, and PSEN1 CTF in brain samples from postnatal day 14 WT mice, transgenic mice overexpressing the FAD-associated A246E PSEN1 mutation (Tg-A246E PSEN1Prp). Right panel, RT-qPCR analysis of Tbp-normalized neurotrypsin mRNA expression from the same samples. E, Western blot analysis of agrin fragmentation in conditioned medium from wild-type, Psen1/2 dKO, and Psen1/2 dKO (+hPSEN1/2) cells. F, RT-qPCR analysis of Tbp-normalized neurotrypsin and Agrn mRNA expression in control siRNA (siControl)- and neurotrypsin siRNA (siNeurotrypsin)-treated Psen1/2 dKO cells (n = 3, mean ± S.E.). G, top panels, Western blot analysis of conditioned medium from the same cells as in F to detect agrin-90 and agrin-22 proteolytic fragments. Bottom panels, quantification of agrin-90 and agrin-22 levels from triplicate experiments (n = 3, mean ± S.E.). All experiments shown in this figure were at least done in triplicate (n = 3). Mean ± S.E. is shown. p values relative to control/wild type are shown when significant (Student's t test): **, p ≤ 0.01; ***, p ≤ 0.001. Representative Western blots are shown in each panel. Error bars represent S.E.

