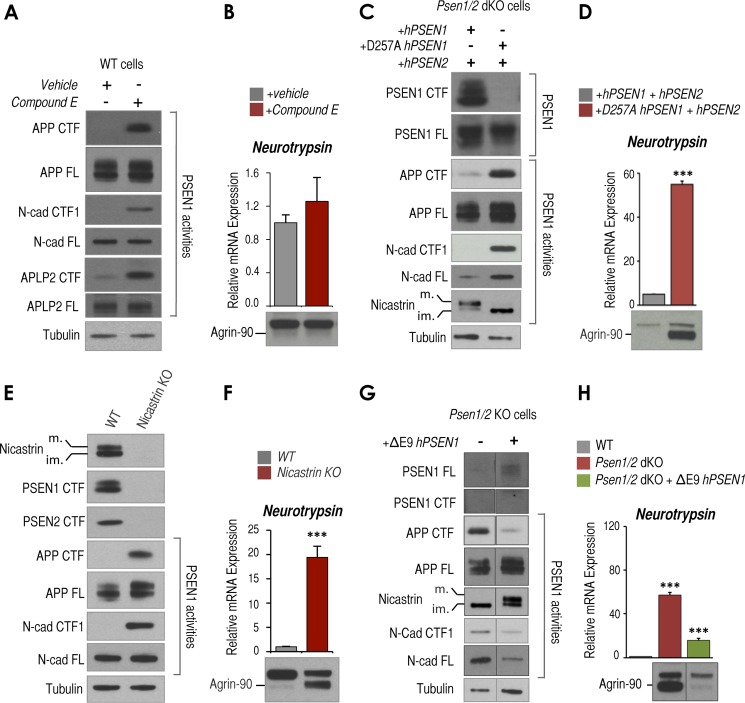
FIGURE 3.
The γ-secretase complex, but not its proteolytic activity, controls neurotrypsin expression and activity. A, Western blot analysis showing APP, N-cad, and APLP2 full length (FL) and corresponding CTFs in wild-type cells treated with DMSO (vehicle) or 0.5 μm Compound E (CE) for 24 h. Tubulin is shown as a loading control. B, RT-qPCR analysis of Tbp-normalized neurotrypsin mRNA expression in wild-type cells treated as in A (top panel) and Western blot analysis of agrin-90 in conditioned medium analyzed (bottom panel) using the same cells as in A. C, Western blot analysis of Psen1/2 dKO (+hPSEN1/2) or Psen1/2 dKO (+hPSEN1 D257A/hPSEN2) cells to detect PSEN1 CTF, PSEN1 full length (FL), APP full length, APP CTF, N-cad full length (FL), N-cad/CTF1, and mature (m.) and immature (im.) nicastrin. Tubulin is shown as a loading control. D, RT-qPCR analysis of Tbp-normalized neurotrypsin mRNA expression (top panel) and Western blot analysis of agrin-90 (bottom panel) in conditioned medium from the same cells as in C. E, Western blot analysis of wild-type (WT) and nicastrin KO cells of mature (m.) and immature (im.) nicastrin, APP full length (FL), APP CTF, N-cad full length, and N-cad/CTF1. Tubulin is shown as a loading control. F, RT-qPCR analysis of Tbp-normalized neurotrypsin mRNA expression (top panel) and Western blot analysis of agrin-90 in conditioned medium (bottom panel) from the same cells as in E. G, Western blot analysis of Psen1/2 dKO and Psen1/2 dKO cells rescued with ΔE9 mutant hPSEN1 to detect PSEN1 full length (FL), CTF, APP full length, APP CTF, mature (m.) or immature (im.) nicastrin, N-cad full length (FL), N-cad/CTF1, and tubulin as loading control. Both samples were run in the same gel but were cut and pasted to adjust to layout of figure. APP full length (FL) Western blot for Psen1/2 dKO sample shown in this panel is the same as the one displayed in Fig. 1I because samples were run in the same gel. H, RT-qPCR analysis of Tbp-normalized neurotrypsin mRNA expression and Western blot analysis of conditioned medium to detect agrin fragments from cells as in G. Both samples were run in the same gel but were cut and pasted to adjust to layout of figure. All experiments shown in this figure were triplicates (n = 3). Mean ± S.E. is shown. p values are shown when significant (Student's t test): ***, p ≤ 0.001. Error bars represent S.E.

