FIGURE 5.
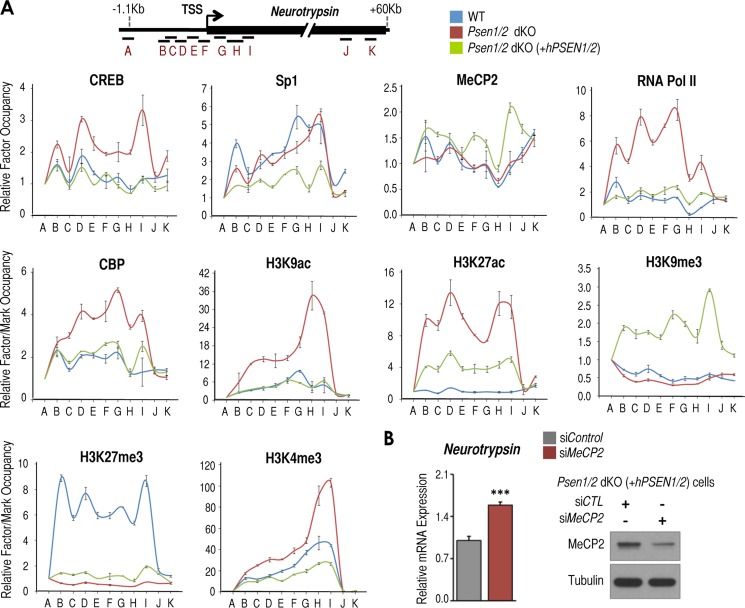
PSEN1/2 regulate the transcriptional and epigenetic states of the neurotrypsin promoter. A, top, scheme of neurotrypsin regions tested by ChIP. A–K indicate genomic regions utilized to detect binding of proteins tested. Bottom panels, ChIP analysis of CREB, Sp1, MeCP2, RNA Pol II, CBP, H3K9ac, H3K27ac, H3K9me3, H3K27me3, and H3K4me3 in wild-type (blue line), Psen1/2 dKO (red line), and Psen1/2 dKO + hPSEN1/2 (green line) cells at the neurotrypsin locus. B, left panel, RT-qPCR analysis of Tbp-normalized neurotrypsin mRNA levels in Psen1/2 dKO (+hPSEN1/2) cells after control (siCTL) or Mecp2-specific (siMeCP2) siRNA-mediated knockdown. Right panel, Western blot analysis of MeCP2 and tubulin in the same cells as in the left panel. This experiment was done in triplicate (n = 3). Mean ± S.E. is shown. p values are shown when significant (Student's t test): ***, p ≤ 0.001. Error bars represent S.E.

