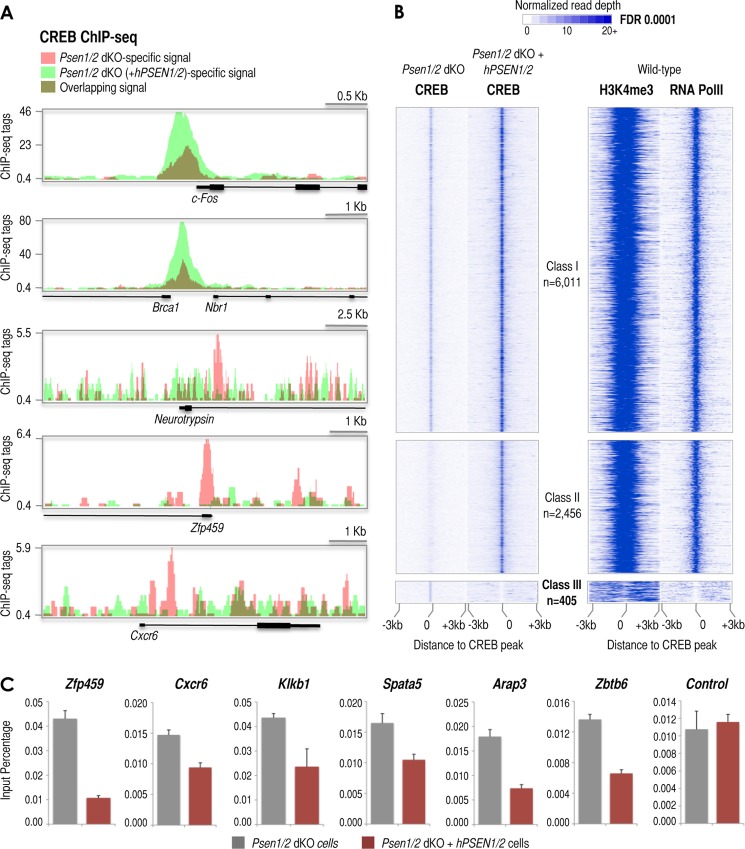
FIGURE 6.
ChIP-seq reveals subsets of CREB target promoters defined by the presence or absence of presenilins. A, UCSC Genome Browser-derived images of CREB ChIP-seq signal at the c-Fos, Brca1, neurotrypsin, Zfp459, and Cxcr6 loci in Psen1/2 dKO (pink) and Psen1/2 dKO + hPSEN1/2 (light green) cells (dark green results from overlapping signals derived from both cells). The ChIP-seq signal (tags), annotated genes, and genomic scale for each image are shown. B, distribution of CREB ChIP-seq signal within ±3-kb windows around ChIP-seq-identified CREB sites. ChIP-seq data aligned with respect to the center of the CREB site (left top panels) identified in Psen1/2 dKO cells or identified in Psen1/2 dKO (+hPSEN1/2) cells (left middle and bottom panels). Three classes of CREB binding sites were identified by ChIP-seq: Class I (left top panel), “non”-affected by presenilins (change ≤4-fold; n = 6,011); Class II (left middle panel), promoted/enhanced by the presence of presenilins (change >4; n = 2,456); and Class III (left bottom panel), suppressed by the presence of presenilins (change >4; n = 405). Right panels depict the distribution of H3K4me3 and RNA Pol II ChIP-seq signals within ±3-kb windows around CREB sites in wild-type cells (29, 30). C, relative occupancy of CREB1 determined by ChIP analysis around the indicated loci and compared with genomic control region A (see Fig. 4A, scheme) in Psen1/2 dKO (gray columns) and Psen1/2 dKO + hPSEN1/2 (colored columns) cells. Error bars represent S.E. FDR, false discovery rate.

