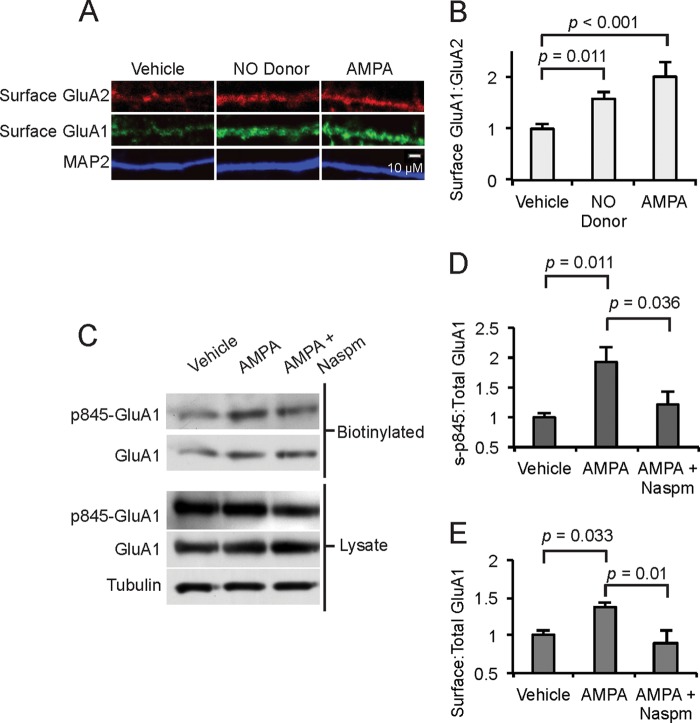
FIGURE 4.
AMPA induces GluA1 trafficking and GluA1 Ser-845 phosphorylation. A and B, accumbens MSNs (10 DIV) were treated with an NO donor (DEA, 50 μm, 10 min) or AMPA (50 μm, 1 min), surface GluA1 and GluA2 were measured, and the surface GluA1:GluA2 ratio was determined. Scale bar = 10 μm; n = 20 dendrite regions. C, accumbens MSNs (10 DIV) were analyzed either directly or after treatment with AMPA (50 μm, 1 min) or NASPM (200 μm, 30 min pretreatment) as indicated. Surface proteins were labeled with biotin, isolated on streptavidin beads, analyzed by Western blot, and Ser(P)-845 GluA1, total GluA1, and tubulin were measured. D, the ratio of surface Ser(P)-845 GluA1:Total GluA1 was determined for the three conditions and normalized to vehicle; n = 4 samples/condition. E, the ratio of biotinylated, surface GluA1:total GluA1 was determined and normalized to vehicle; n = 4 samples/condition. Data are represented as the mean ± S.E. normalized to vehicle treatment and analyzed using one-way ANOVA followed by Fisher's post hoc tests.

