
FIGURE 5.
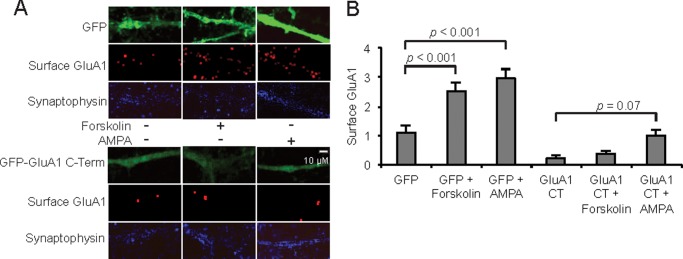
Confirmation of AMPA-induced GluA1 trafficking through genetic blockage of trafficking. Surface GluA1 was visualized (A) and quantified (B) in MSNs (10 DIV) infected with lentiviruses expressing GFP or the GluA1 C-terminal (CT) peptide tagged with GFP. Infections were carried out 4 days before treatment with AMPA or forskolin (25 μm, 10 min). Synaptophysin levels were unchanged among all conditions. Scale bar = 10 μm. AMPA treatment = 5 μm, 1 min in each case. Data are represented as the mean ± S.E. integrated density of surface GluA1; n = 20 dendrite regions, and data are represented as the mean ± S.E. normalized to vehicle treatment and analyzed using one-way ANOVA followed by Fisher's post hoc tests.