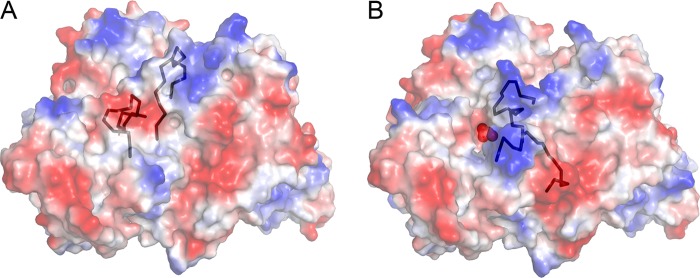
FIGURE 9.

Electrostatic surface analysis of apoenzyme (A) and holoenzyme (B). Electrostatic surfaces are colored blue in the positive region and red in the negative region. The C terminus and the mobile loop are shown in a black ribbon representation. PLP is indicated as red spheres in B.
