
FIGURE 6.
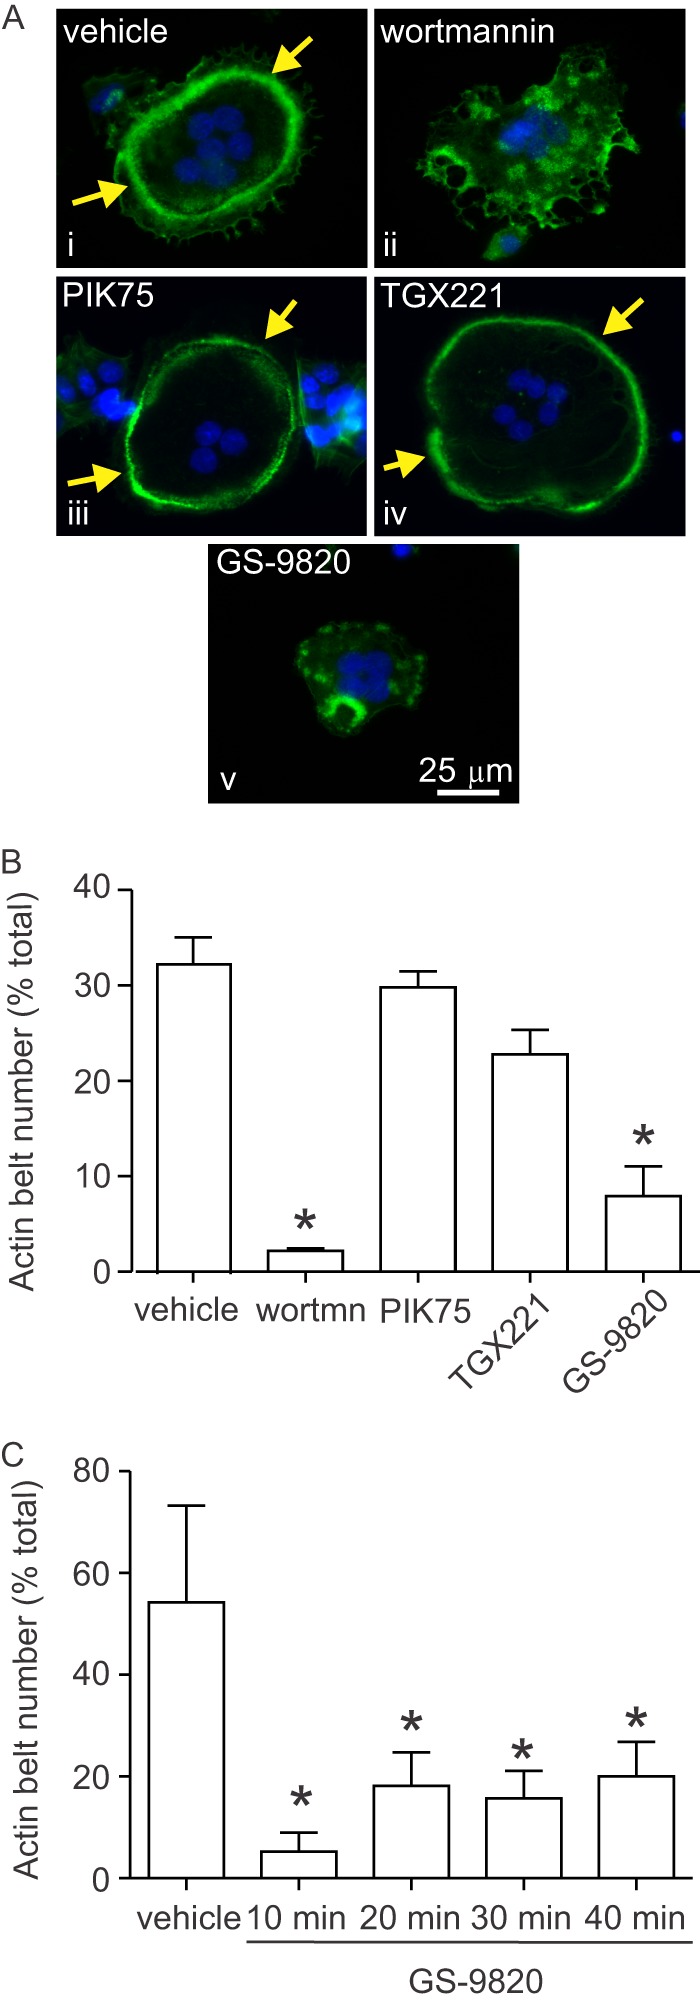
Effects of PI3K inhibitors on actin belt organization in osteoclasts. Rat osteoclasts were plated on FBS-coated glass coverslips in HCO3−-buffered M199 with FBS and antibiotics. Samples were treated with vehicle or inhibitor for 10 min and then fixed. F-actin was labeled using Alexa Fluor 488-conjugated phalloidin (green), nuclei were stained with 4′,6-diamidino-2-phenylindole (DAPI, blue), and cells were examined by fluorescence microscopy (×40 objective, Zeiss Axio Observer Z1). Inhibitors were wortmannin (wortmn), PIK75, TGX221, and GS-9820 (all 1 μm). A, i, image shows a single untreated rat osteoclast exhibiting a prominent F-actin belt at the cell periphery. A, iii and iv, F-actin belts were also observed in osteoclasts treated with PIK75 and TGX221. A, ii and v, in contrast, osteoclasts treated with wortmannin or GS-9820 for 10 min displayed a disorganized pattern of F-actin staining with clusters of punctate structures. B, we quantified the number of osteoclasts exhibiting actin belts (encompassing at least 75% of the cell periphery). Osteoclasts treated with wortmannin or GS-9820 displayed significantly fewer actin belts than vehicle-treated cells, whereas PIK75 and TGX221 had no significant effect. Data are the percentage of osteoclasts exhibiting actin belts and are mean ± S.E., n = 3 independent experiments with a total of 1,537 osteoclasts. C, effects of PI3K inhibition were persistent. Osteoclasts treated with GS-9820 for up to 40 min displayed significantly fewer actin belts than vehicle-treated cells. Data are the percentage of osteoclasts exhibiting actin belts and are mean ± S.E., n = 4 independent experiments with a total of 1,546 osteoclasts. Data were analyzed by one-way ANOVA followed by Tukey's multiple comparisons test. * indicates p < 0.05 compared with vehicle.