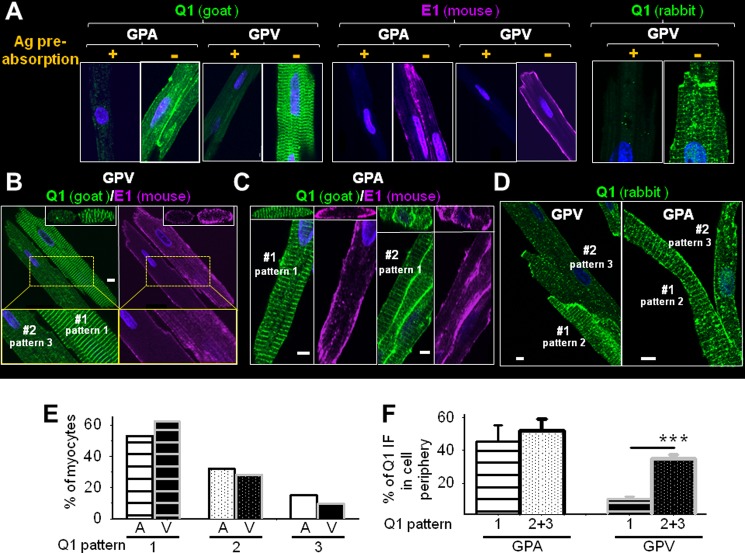
FIGURE 1.
Native KCNQ1 and KCNE1 (abbreviated as Q1 and E1) in cardiac myocytes are often not colocalized. A, validating KCNQ1 pAbs (goat and rabbit) and KCNE1 mAb (mouse) for detecting native proteins in GPA and GPV myocytes, respectively, using immunofluorescence (IF). +, Ab preincubated with antigen (Ag) overnight; −, Ab preincubated overnight in buffer without antigen. B and C, simultaneously detecting three-dimensional distribution patterns of KCNQ1 and KCNE1 in ventricular and atrial myocytes using KCNQ1 goat pAb and KCNE1 mouse mAb. The main panels depict x-y plane images of KCNQ1 and KCNE1 immunofluorescence signals taken from the central z slice, with x-z plane images reconstructed from the z-stacks shown on top. In B, enlarged views of the areas boxed in yellow frames are shown below. D, KCNQ1 rabbit pAb detected similar variations in KCNQ1 distribution patterns in ventricular and atrial myocytes. In each panel, a cell or cell cluster is identified as #1 or #2, and the KCNQ1 distribution patterns are noted (the definition of KCNQ1 distribution patterns is described in the text). Scale bars in B–D = 5 μm. E, percentages of atrial (A) and ventricular (V) myocytes manifesting KCNQ1 distribution patterns 1, 2, and 3. F, degrees of KCNQ1 presence in periphery of atrial and ventricular myocytes of KCNQ1 distribution pattern 1 versus 2 or 3. ***, t test, p < 0.001.

