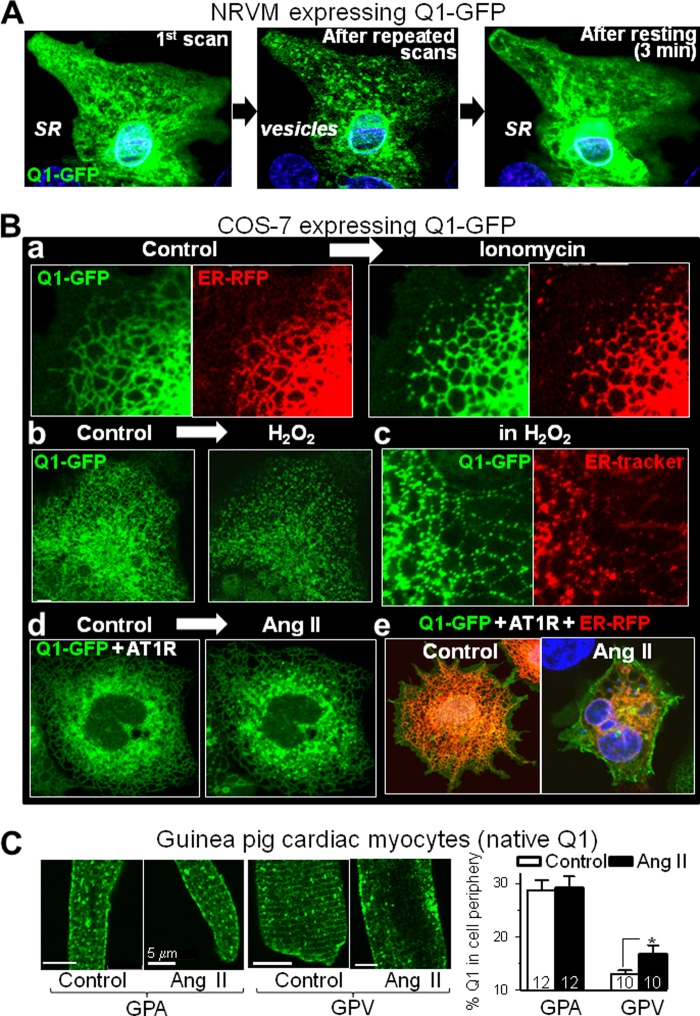
FIGURE 9.
In response to stress ([Ca2+]i elevation and/or oxidative stress), KCNQ1 exits the ER/SR in vesicles and travels to the cell periphery. A, Q1-GFP redistribution in a beating NRVM after repeated laser scans. Left panel, first scan. Center panel, after 60 scans applied once every 5 s. Right panel, scan obtained after resting (stopping laser scans) for 3 min. B, Q1-GFP redistribution in live COS-7 cells in response to stress. a, before and after ionomycin (10 μm) application to a cell expressing Q1-GFP and ER-RFP. b, before and after H2O2 (0.1%) application to a cell expressing Q1-GFP. c, images of a cell expressing Q1-GFP with the ER stained by ER Tracker in the presence of 0.1% H2O2. d, before and after Ang II (1 μm) application to a cell expressing Q1-GFP and angiotensin type 1 receptor (AT1R). e, images of two cells expressing Q1-GFP, AT1R, and ER-RFP under control conditions or after incubation with Ang II (1 μm, 60 min). C, the effect of incubation with Ang II (1 μm, 60 min) on native KCNQ1 distribution in guinea pig atrial and ventricular myocytes. The same batch of myocytes was incubated under the same conditions without Ang II as a control. Left panel, representative KCNQ1 immunofluorescence images. Right panel, quantification of the percentage of KCNQ1 signal in the cell periphery. Numbers of myocytes analyzed are shown (from one animal). *, p < 0.05. Live cell imaging and incubation with Ang II were all carried out at 37 °C. Scale bars = 5 μm. Videos of time-lapse live cell imaging are available in the supplemental information.

