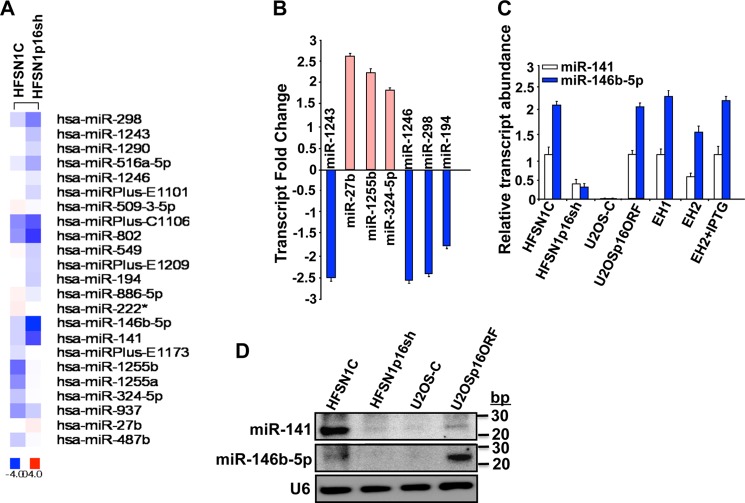
FIGURE 2.
p16-dependent differential expression of miRNAs. A, total RNA samples were prepared from the indicated cells and were used to perform microRNA array. B and C, qRT-PCR using primers corresponding to the indicated genes. The relative transcript values were normalized to GAPDH transcript levels. Error bars represent means ± S.D. D, total RNA was extracted from the indicated cells utilizing the RNeasy mini kit (Qiagen), and then was used for Northern blot analysis.

