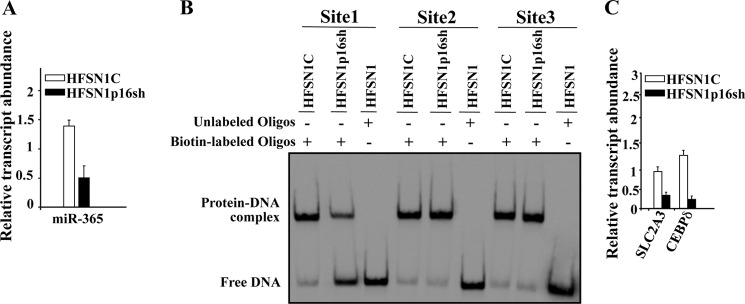
FIGURE 9.

p16 modulates the expression of different Sp1 targets. A and C, total RNA was prepared from the indicated cells, and quantitative RT-PCR was performed using specific primers for the indicated genes. B, EMSA was performed using nuclear extracts from the indicated cells and biotin-labeled oligonucleotides corresponding to three different Sp1 consensus-binding sites of the miR-365 promoter. Error bars represent means ± S.D. Oligos, oligonucleotides.
