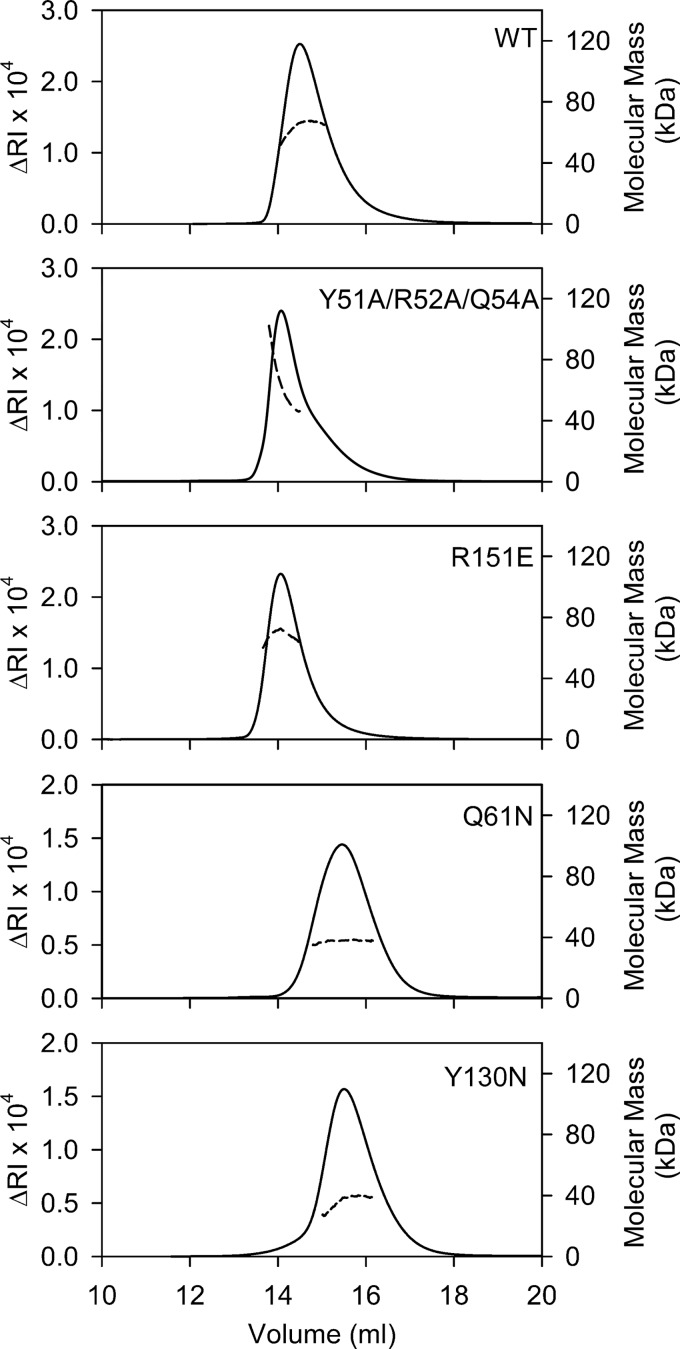
FIGURE 2.
SEC-MALS analysis of WT mouse decorin and the dimer interface mutants. The proteins were injected onto a Superdex S200 column at a concentration of 3 mg/ml and run in TBS. The solid lines represent the refractive index (RI) detector signal (left y axis), and the dashed lines represent the molecular mass of the glycoprotein polypeptide fraction (right y axis) as determined by the three-detector method (26).

