FIGURE 7.
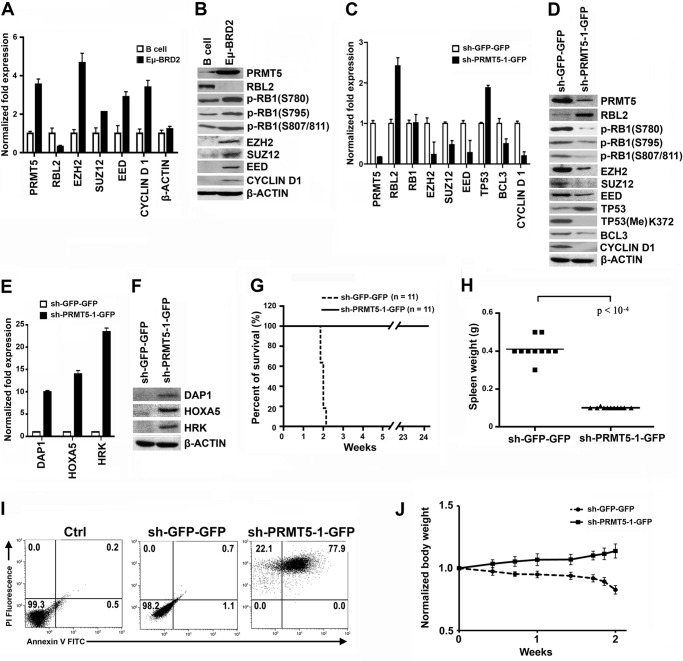
Expression of PRMT5, PRC2, and cyclin D1 is elevated in mouse primary lymphoma cells. A, real-time RT-PCR was performed on total RNA from normal B and Eμ-BRD2 cells, and the levels of the indicated target genes were determined as described in the legend to Fig. 1B. β-Actin mRNA levels are shown as a control. B, RIPA extracts (40 μg) were analyzed by immunoblotting using the indicated antibodies. Total RNA (C and E) and RIPA extracts (D and F) were collected 48 h after infection, and the levels of the indicated target genes and proteins were determined. G, Kaplan-Meier curve showing survival of mice injected with activated Eμ-BRD2 cells infected with either control sh-GFP-GFP or sh-PRMT5-1-GFP lentivirus. Eμ-BRD2 cells were activated for 24 h by adding recombinant human interleukin-4 (15 ng/ml) and goat anti-human IgG + IgM (15 μg/ml) before infection with control sh-GFP-GFP or sh-PRMT5-1-GFP lentivirus. GFP-positive control and test cells were purified by FACS analysis and injected into sublethally irradiated FVB mice. H, weight of spleens isolated from mice shown in G. I, activated Eμ-BRD2 lymphoma cells were infected with either control sh-GFP-GFP or sh-PRMT5-1-GFP lentivirus, stained with propidium iodide (PI) and annexin V 72 h later, and analyzed by FACS analysis as described in the legend to Fig. 3B. Activation of Eμ-BRD2 cells was carried out by adding 15 ng/ml recombinant human interleukin-4 and 15 μg/ml goat anti-human IgG + IgM. J, weights of individual mice (n = 11/group) injected with either sh-GFP-GFP- or sh-PRMT5-1-GFP-infected lymphoma cells were monitored for 2 weeks and normalized to one at day 0. The average weight for each group is plotted as means ± S.D.

