
FIGURE 4.
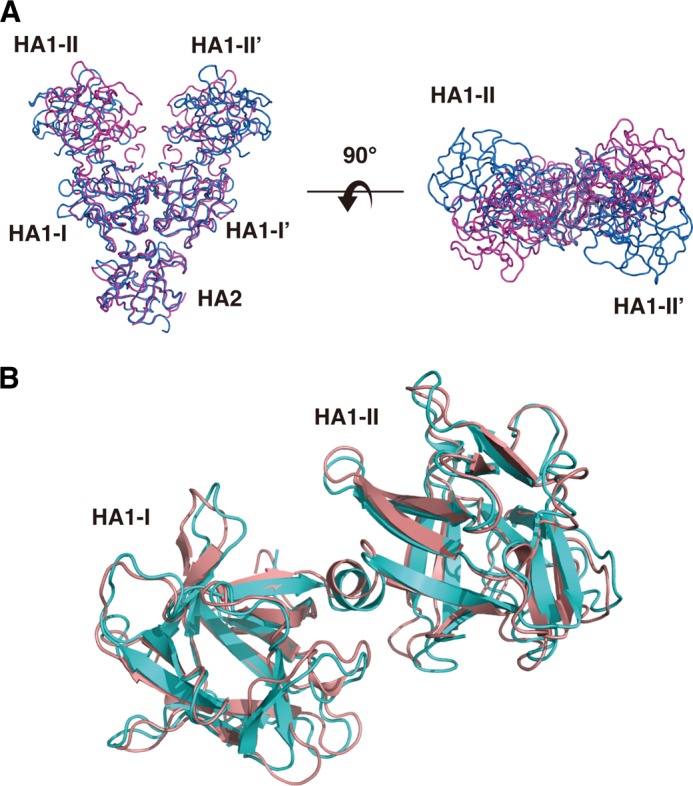
Comparison of the structure of HA1. A, structural comparison of type B HA1-HA2 (blue) with type D HA1-HA2 (magenta). The structures were superimposed using the SSM program in Coot. HA2, HA1-I, and HA1-I′ overlapped well with each other. The structural differences occur mainly on HA-II and HA1-II′, which are sugar-binding sites. B, structural comparison of type B HA1 (pink) with type A HA1 (cyan).