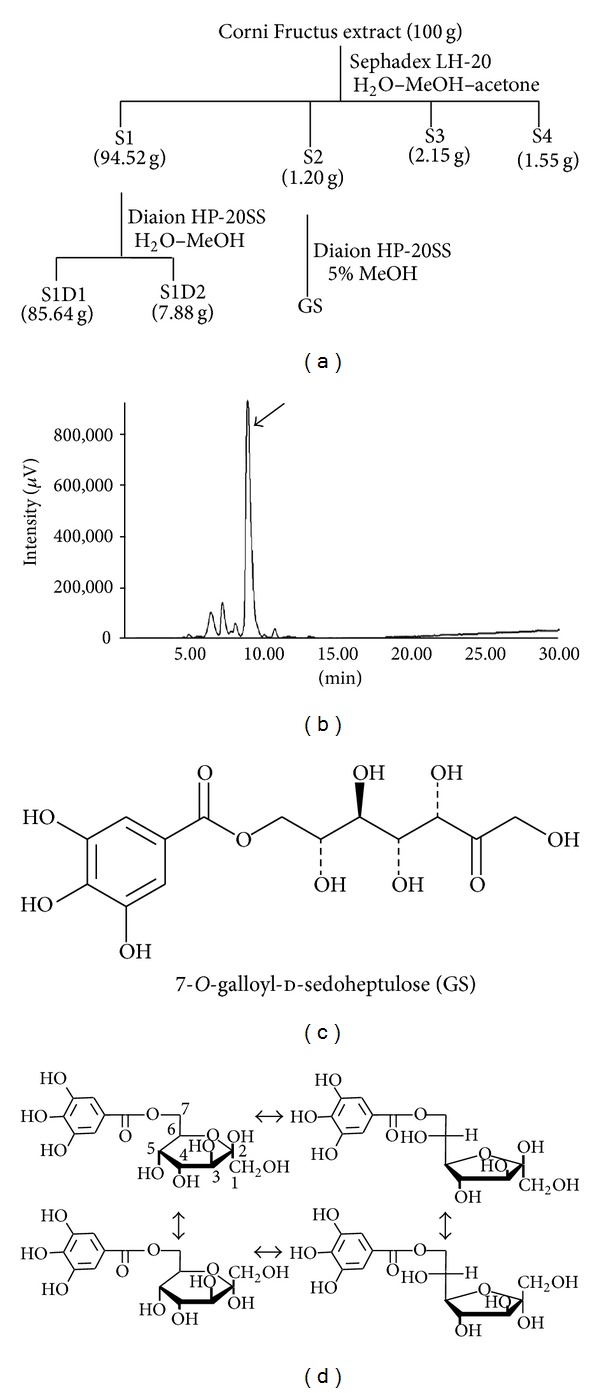
Figure 1.

Fractionation of Corni Fructus, HPLC profile of GS, and its structure. (a) Fractionation of Corni Fructus was performed as described in Biological & Pharmaceutical Bulletin, vol. 30, no. 7, pp. 1289–1296, 2007. (b) HPLC profile. The large peak shown by the arrow is the structure of GS, as described in (c), and the other peaks represent its four isomers, as described in (d).
