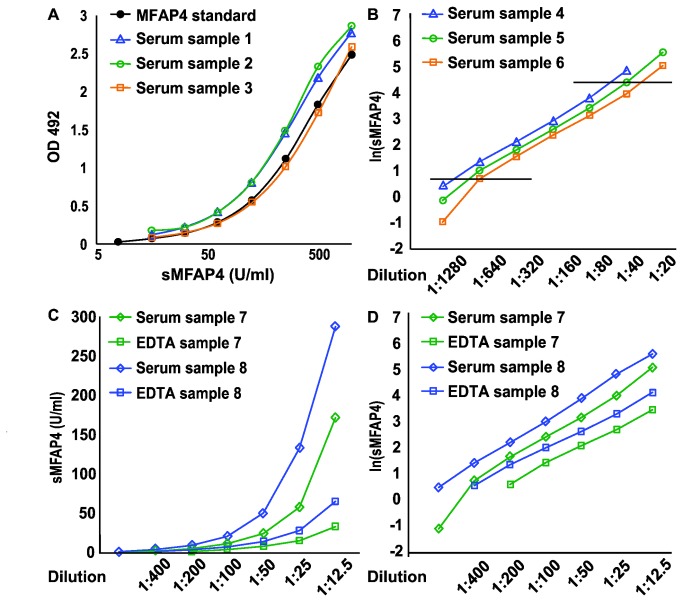
Figure 2. Validation of parallelism and range estimation.
A. Two-fold dilution curves of sMFAP4 ELISA measurements of samples from 3 representative blood donors illustrate parallelism. The black line represents the standard two-fold dilution curve of culture supernatant from CHO cells expressing recMFAP4 (ranging from 1:100 to 1:6,400). By four-parameter logistic regression, this standard curve is used to estimate the sMFAP4 content in the blood donor samples. B. The range of the sMFAP4 ELISA estimated by logarithmically transformed results from two-fold dilution curves similar to A. The results from another set of 3 representative serum samples are shown; the horizontal lines correspond to the highest and lowest acceptable measurements (corresponding to sMFAP4 values of 77.2 U/ml and 1.3 U/ml, respectively). C. The difference in sMFAP4 measurement in serum and EDTA-plasma samples is illustrated using samples from 2 healthy blood donors in a two-fold titration. D. Parallelism between serum and plasma is obvious after logarithmically transforming the sMFAP4 measurements shown in C. OD: Optical density.

