
Figure 4.
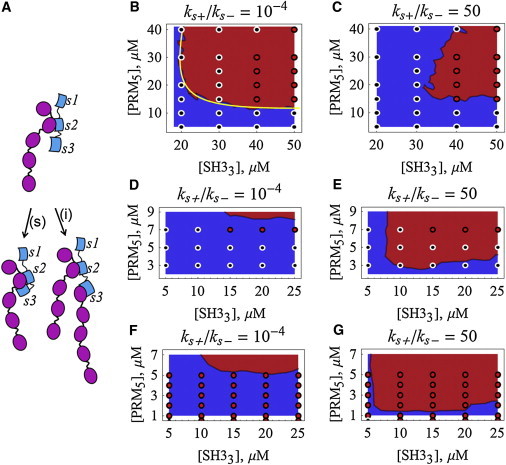
Impact of synergistic interactions in sol-gel transition diagrams. (A) The second and third SH3 domains of Nck may act independently (i) or synergistically (s). Sol-gel transition diagrams for systems with trivalent molecule SH33 (of Nck) binding to pentavalent molecule PRM5 of (N-Wasp), without (B and C) or with (D–G) the inclusion of Nck binding to nephrin. Plots in D–G are simulated with 9 μM of phosphorylated tyrosine sites distributed among bivalent (D and E) or trivalent (F and G) molecules. The intensity of the synergistic interaction between the last two SH3 domains is represented by the ratio ks+/ks−. The results shown are averages of 20 simulations for each condition, with 50 molecules/μM (B and C) or 250 molecules/μM (D–G). The occurrence of rings in the largest cluster is used to identify the occurrence of a gel phase. Experimental data for Nck and N-Wasp are represented by the circles (red, gel phase present; black, gel phase absent) (1). The yellow line in B corresponds to the F-S theoretical prediction when ks+ = 0. To see this figure in color, go online.