


Figure 3.
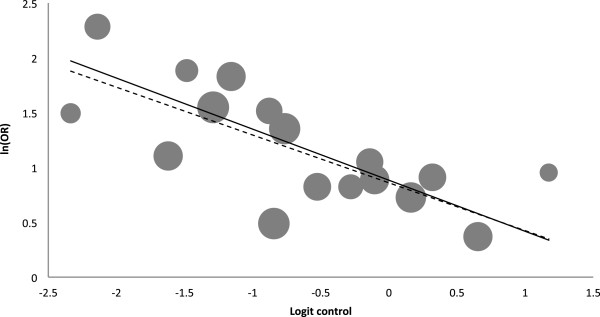
Meta-regression of the effect of control event rate: logit control vs ln(OR). The dashed line is prior to bias correction. The solid line is after bias correction. The area of each circle is proportional to the weight for that study. OR, odds ratio.