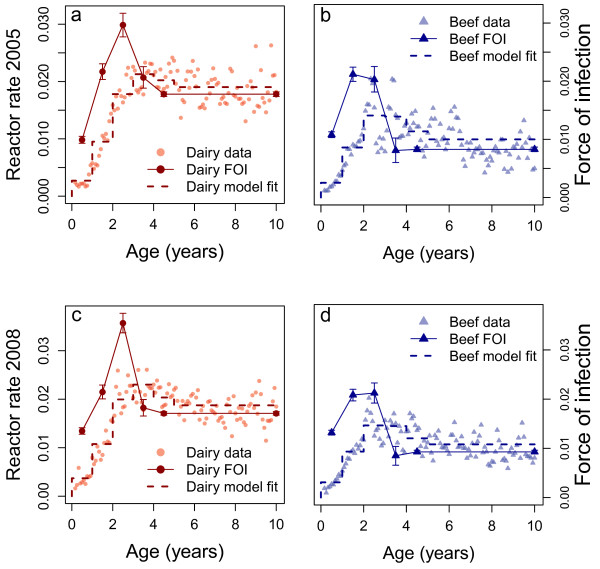
Figure 2.
Age specific reactor rates and estimated force of infection. Panels a) and b) show data and fits for the age and year model for 2005; panels c) and d) for 2008 for dairy (panels a and c) and beef (panels b and d) cattle. In each panel, age-specific reactor rates are given by the points; the joined points with error bars show the mean estimated age-specific force of infection with 95% credible intervals and the step function shows the model fit using the mean force of infection for each cohort.

