
Figure 3.
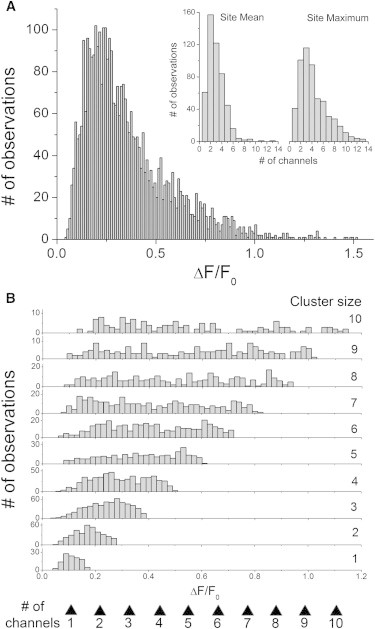
Distributions of event amplitudes at sites of differing cluster size. (A) Overall distribution of event amplitudes derived from 562 puff sites (n = 3499 events). For clarity two events with amplitudes >2.5 ΔF/F0 are omitted. Inset graphs show distributions of event amplitudes between different sites. Left, numbers of sites where the mean puff amplitude corresponded to the opening of one, two, three, etc., channels. Right, corresponding distribution of sites in terms of the largest event observed at a site. (B) Distributions of event amplitudes (scaled as both ΔF/F0 and estimated number of open channels) after grouping by cluster size (indicated at right).