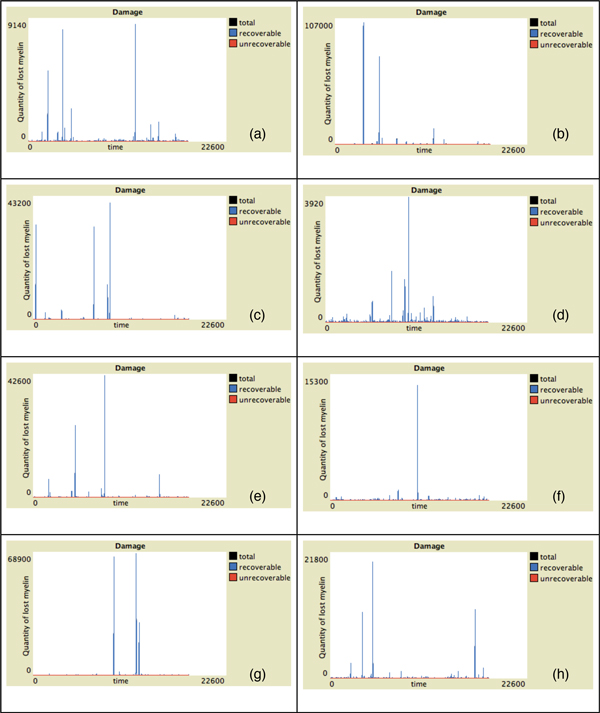
Figure 4.
Damage progression vs time in healthy patients. Simulation of eight randomly-selected healthy virtual patients. Simulation time is 5 years (18250 time-steps). Red lines represent activated unrecoverable damage, blue lines represent recoverable damage and black lines total damage (recoverable + unrecoverable). Some spikes on the recoverable damage curves are present. However such damage is usually recovered in healthy patients, as at the end of simulations the total damage is mostly 0.

