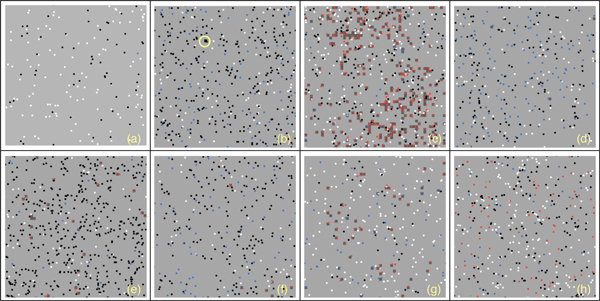
Figure 6.

Spatial plot at the end of the simulation in healthy patients. Figure gives a spatial representation of the simulated scenario (i.e. a small portion of brain tissues) at the end of the simulation for eight randomly-selected healthy virtual patients. Light green patches represent non-damaged areas. Dark green patches (see for example plot (c)) represent areas with recoverable damage. Black patches (see for example plot (b), yellow circle) represent areas with unrecoverable damage. Red dots represent activated Teff and blue dots represent activated Treg. Green dots represent viruses. White and black dots represent resting Teff and Treg, respectively.
