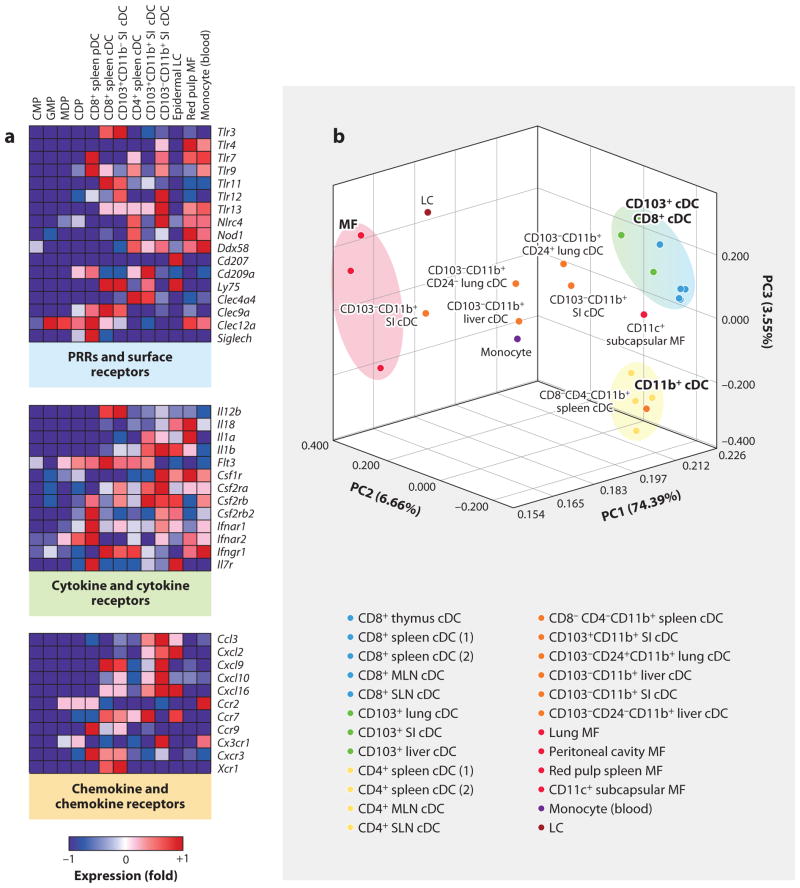
Figure 1.
Heat map representation of transcripts differentially expressed in progenitor and differentiated DCs. (a) Heat map representation of pathogen-recognition receptors (PRRs) and antigen receptors, cytokine and cytokine receptors, and chemokines and chemokine receptors in common myeloid progenitors (CMPs), granulocyte macrophage progenitors (GMPs), macrophage DC progenitors (MDPs), common DC progenitors (CDPs), and CD8+ spleen pDCs, CD8+ spleen cDCs, CD103+CD11b− lamina propria cDCs, CD4+ spleen cDCs, CD103+CD11b+ lamina propria DCs, CD103− CD11b+ lamina propria cDCs, epidermal Langerhans cells (LCs), red pulp macrophages (MFs), and blood monocytes. Red represents high and blue represents low relative expression. (b) Principal components analysis (PCA) of 15% of the most variable transcripts expressed by lymphoid tissue CD8+ cDCs, lymphoid tissue CD8− cDCs, nonlymphoid tissue CD103+ cDCs, nonlymphoid tissue CD11b+ cDCs, epidermal LCs, monocytes, and MF populations provides a visual representation of the heterogeneity of the mononuclear phagocytic lineage. cDC and MF populations cluster distinctly on opposite sides of the PCA, whereas the CD11b+ cDC distribution throughout the PCA suggests that these cells are more heterogeneous. Intriguingly, the CD11c subcapsular MF population clusters near DCs, suggesting that this population is more closely related to DCs than to macrophages (which is further suggested by the expression of zbtb46). (Additional abbreviations used in figure: MLN, mesenteric lymph node; SI, small intestine; SLN, skin-draining lymph node.)

