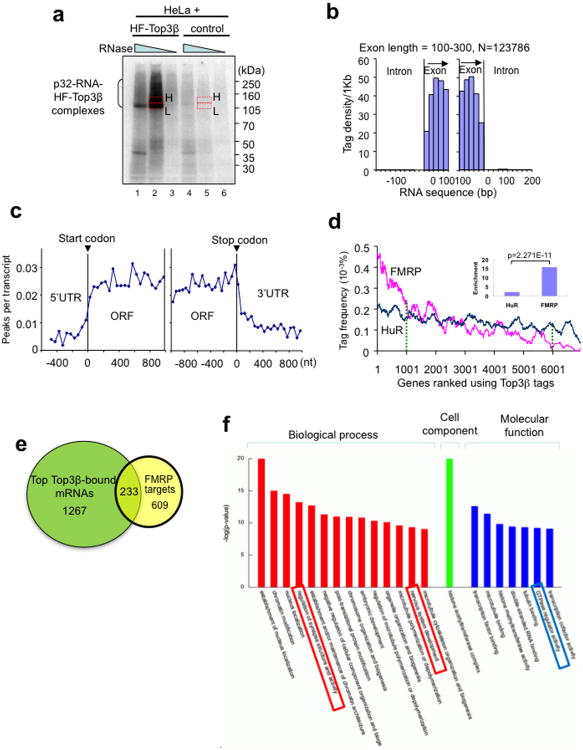
Figure 5. Top3β binds coding regions of mRNAs, and its bound mRNAs are enriched with match FMRP targets.
(a) Autoradiograph of a SDS-PAGE gel from the HITS-CLIP assay shows that a significant amount of 32P-labeled RNA was crosslinked to HF-Top3β. A mock immunoprecipitation was performed using HeLa cells that do not express HF-Top3β. The RNA in gel slices marked H (high) and L (low) were extracted, reverse-transcribed, and sequenced; but only data from H are presented. (b) Histogram illustrates that Top3β binding sites, represented by sequence tags identified by HITS-CLIP, preferentially map to exons, but not introns. The number of sequence tags was counted at specific distances from exon start (left graph) and exon end (right graph) and then converted to tag density per 1 Kb. Data for longer exons are included in Supplementary Fig. 5. (c) A graph showing that Top3β binding sites on mRNAs are enriched in open-reading frames (ORFs), but not in 5′ or 3′ untranslated regions (UTRs). Peaks are locations with >15 tags. (d) A ranked plot shows that genes containing higher frequency of Top3β tags are enriched with FMRP targets (red line) than those with lower frequency of Top3β tags. The small inlet graph shows that the ratio between the number of FMRP targets in the top 1000 mRNAs with highest Top3β tag frequency vs. that in the bottom 1000 mRNAs with lowest Top3β tag frequency. The enrichment for HuR was included for comparison. The statistical analyses used Chi-square test. (e) A Venn diagram shows the number of top Top3β targets that overlap those of FMRP13. These common targets are listed in Table S2. (f) A graph shows the top gene ontology (GO) terms that are enriched in the common targets of Top3β and FMRP. The GO terms are ranked by –log (P values). The boxes highlight the categories that may be relevant to functions of Top3β and FMRP in neurons. The genes of each category are listed in Supplementary Table 4.

