
Fig. 2.
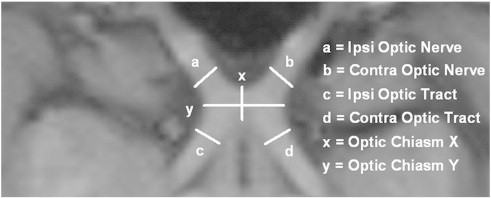
An axial image of a reformatted T1 weighted scan from a control participant displaying optic nerves (a) ipsilateral and (b) contralateral to the dominant eye, optic tracts (c) ipsilateral and (d) contralateral to the dominant eye, and optic chiasm widths in the (x) X and (y) Y planes.