
Fig. 3.
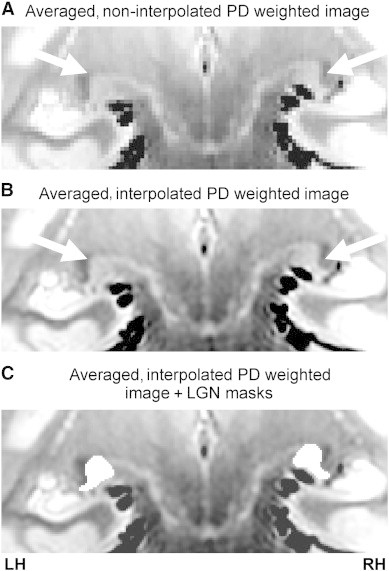
Coronal slice of an averaged PD weighted image depicting the LGN (white arrows) of a control participant when the PD images were (A) not interpolated and when they were (B) interpolated. Left and right ROI tracings of the LGN (white) in the averaged, interpolated PD weighted image are also shown (C).