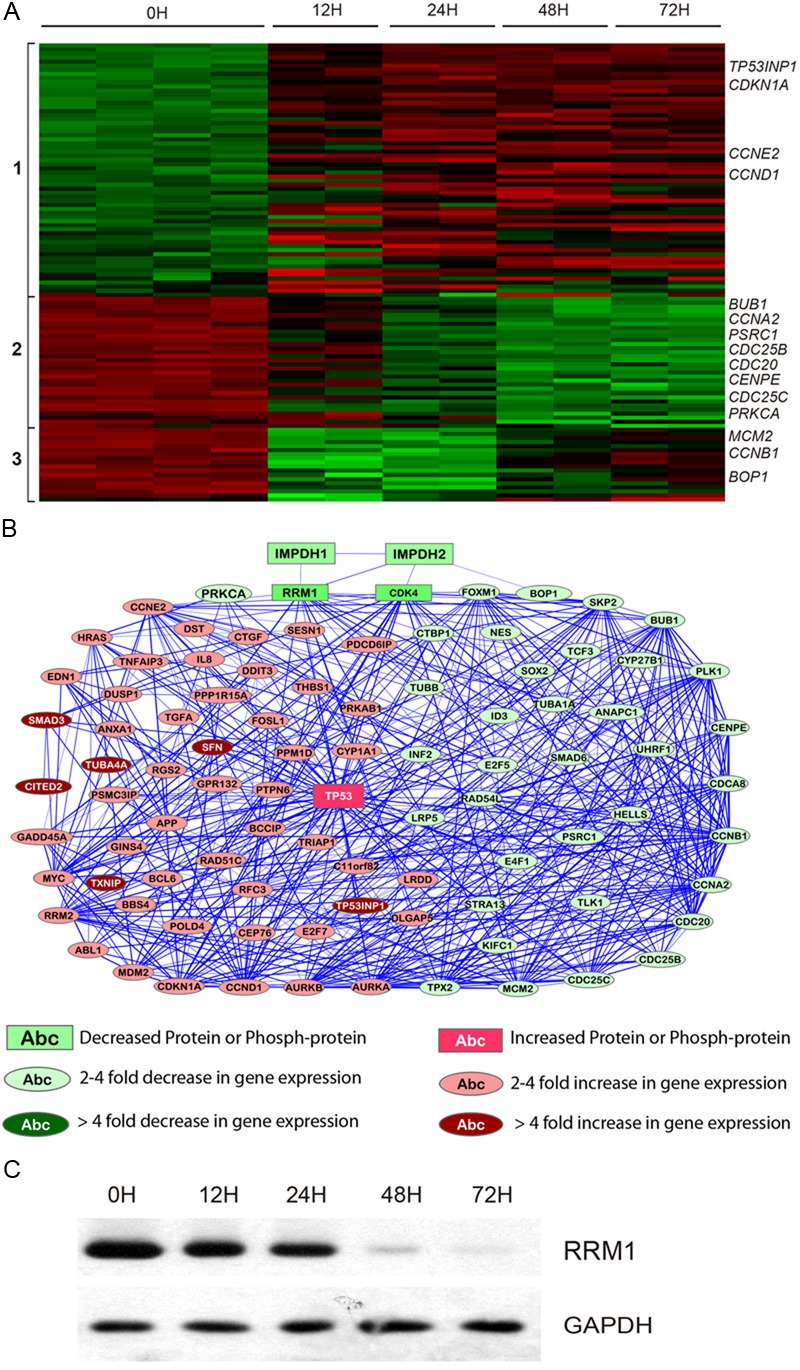
Figure 1.

Molecular changes related to cell cycle arrest induced by MPA treatment. A: Heatmap for genes differentially expressed after MPA treatment for 0h, 12h, 24h, 48h and 72h. Each sample is represented in a column and each gene is represented in a row. Increased expression is indicated as red and decreased expression is indicated as green. Representative genes are shown on the right panel and gene clusters are indicated on the left. B: A network illustrating the connectedness of the genes (>2-fold differences) involved in cell cycle regulation. C: Western blot for RRM1.
