
Figure 3.
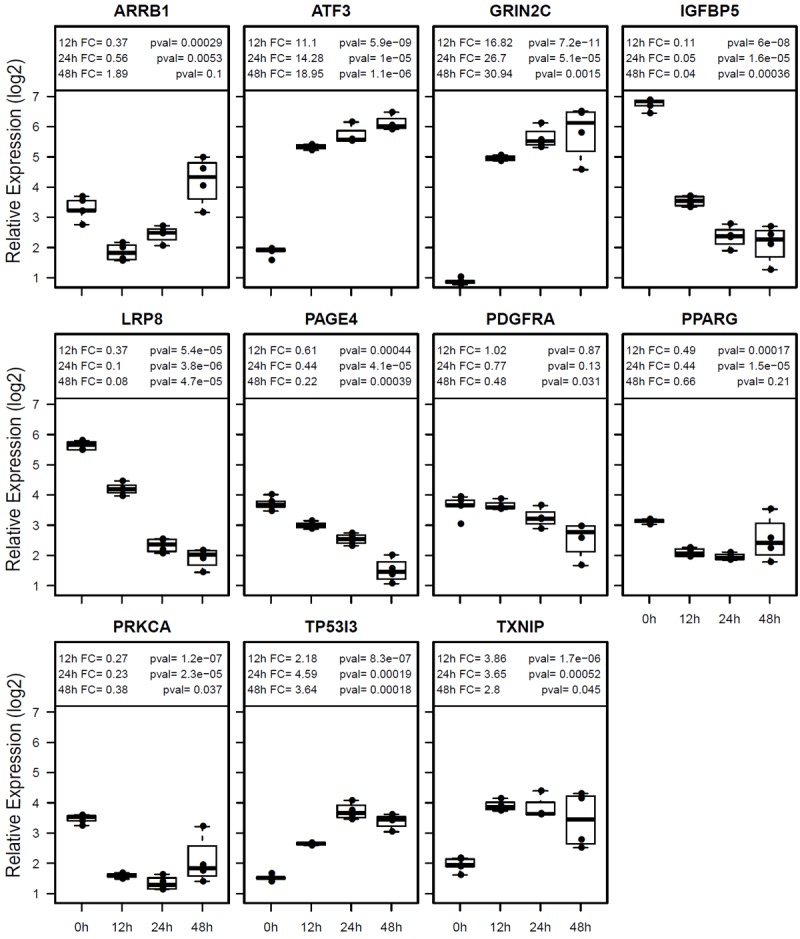
Confirmation of gene expression differences in AGS cells by real-time RT-PCR. Box blots are shown for each gene. Relative expression levels are shown in log 2 scale. FC (fold change) for each time point (12h, 24h and 48h) is compared to untreated controls (0h) with respective p-values.