
Figure 5.
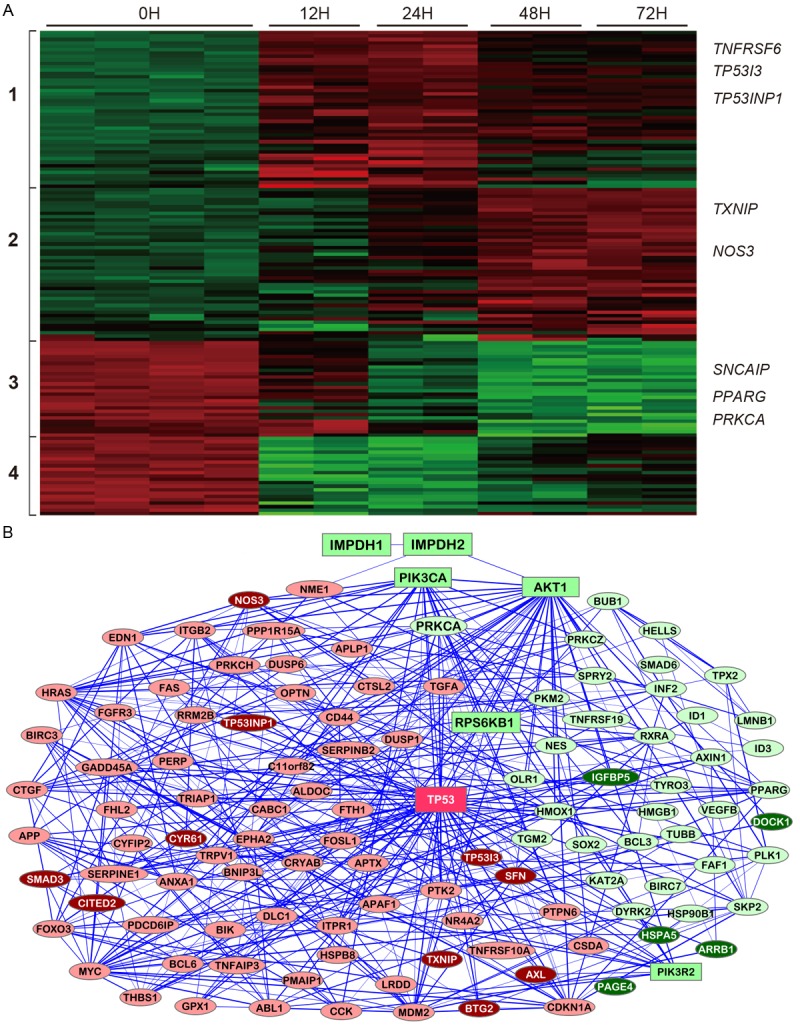
Molecular changes related to induction of apoptosis induced by MPA treatment. A: Heatmap for genes differentially expressed after MPA treatment for 0h, 12h, 24h, 48h and 72h. B: A network illustrating the connectedness of the genes (>2-fold differences).