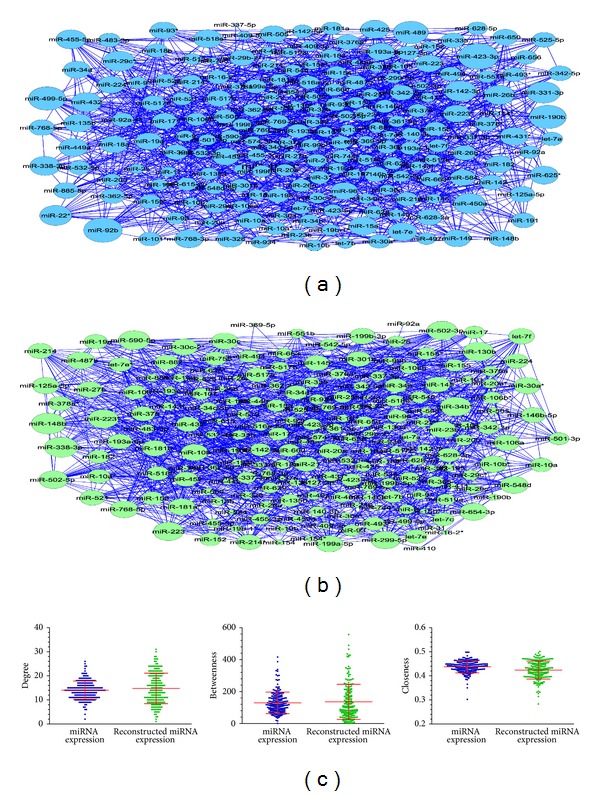
Figure 2.

Two constructed miRNAs interaction networks. (a) miRNAs interaction network using the original miRNA expression profiling data. The larger blue circle indicates the miRNA with greater degree and vice versa. (b) miRNAs interaction network using the reconstructed miRNA expression dataset. The larger green circle indicates the miRNA with greater degree and vice versa. (c) The comparison of topological properties (average degree, average betweenness, and average closeness) between two miRNAs interaction networks.
