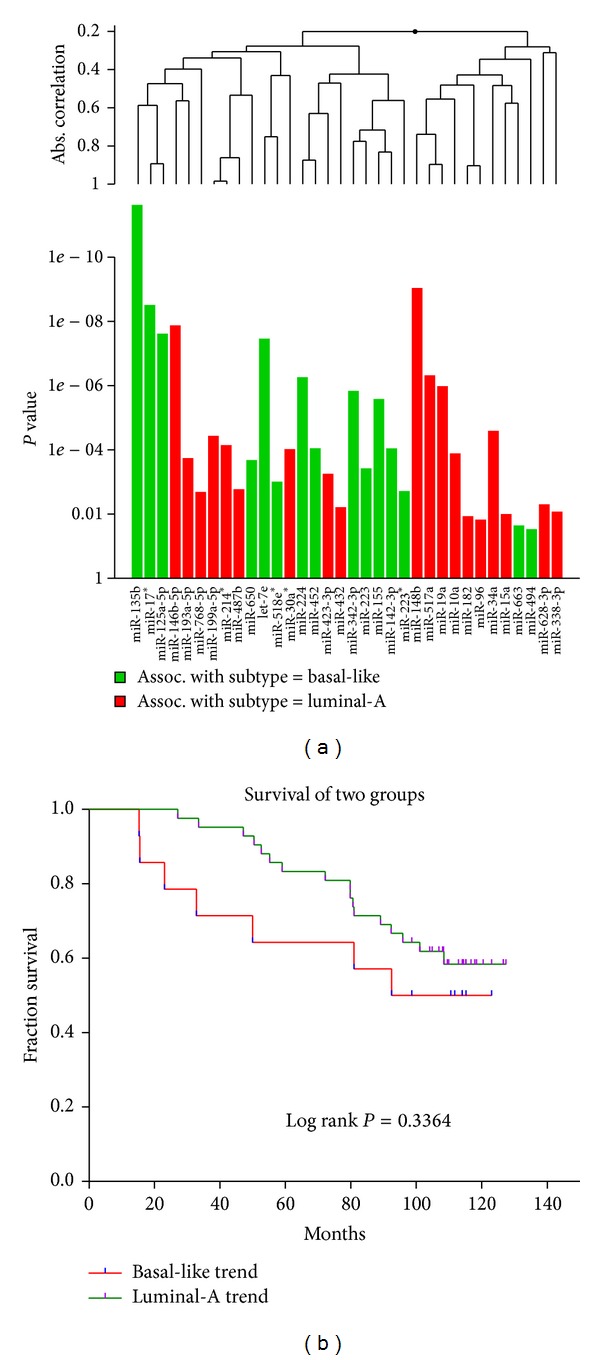
Figure 6.

(a) Global test for 34 candidate hub miRNAs shared by two constructed miRNAs interaction networks. This graph is based on the decomposition of the test statistic into the contributions made by each of miRNAs in the alternative hypothesis. The graph illustrated the P values of the tests of individual component miRNAs of the alternative. The plotted miRNAs are ordered in a hierarchical clustering graph. The clustering method is average linkage. (b) Survival analysis for 34 candidate hub miRNAs shared by two miRNAs interaction networks. Samples were classified using K-means clustering based on the expression levels of 34 candidate miRNAs into two groups which were defined as luminal-A trend or basal-like trend according to the proportion of two breast cancer subtype samples.
