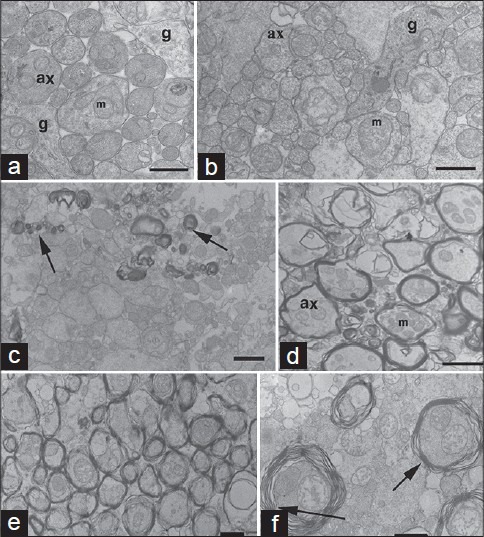
Figure 2.

(a) Ganglion cell axons from normal temporal retina (S843; 77-year-old female, 20-h fixation delay) can be compared to unmyelinated axons of S694 (b; R1, Fig. 3). Note, axons (ax) in A and B show no signs of degeneration; preservation was sufficient to see neurofilaments, mitochondria (m) and glia (g). (c) Micrograph shows scattered myelinated axons (arrows; S694 R1). (d) Myelinated axons (S694; R2, Fig. 3). (e and f) myelinated axons of the central region of S656 (R2 Fig. 4). Arrows show areas measured for axons with separated lamella. Scale bar; A, B- 0.5956;m; C, E- 1.0 μm; D, F- 2.0 μm
