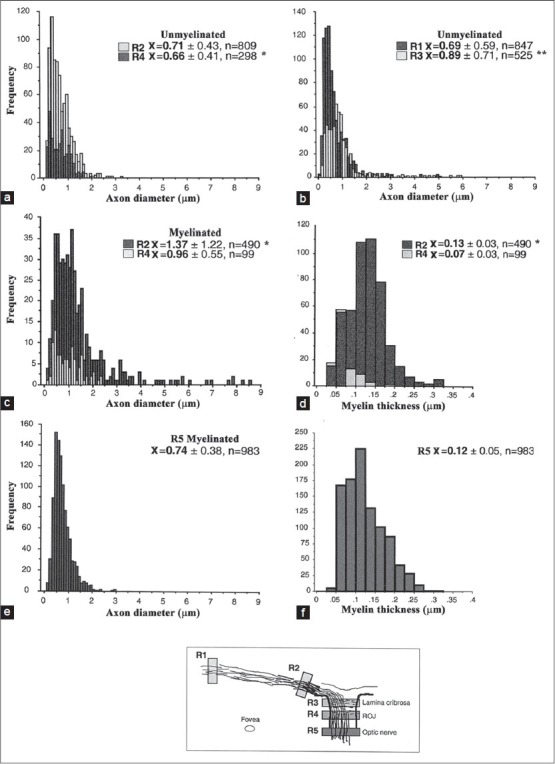
Figure 4.

Analysis of axon diameter and myelin thickness in specimen S656. (a, b) The distribution of unmyelinated axon diameters at the three locations shown in the schematic diagram (R1 vs. R2 was not significant). (c, d) The distribution of myelinated axon diameters at three locations are shown (R5 vs. R2**, R5 vs. R4**). (e, f) The distribution of myelin thickness for the same areas (R5 vs. R4*, R5 vs. R2 ns). *P< 0.05; **P<0.01, ns- nonsignificant (t-test). ROJ corresponds to the retinal optic-nerve junction
