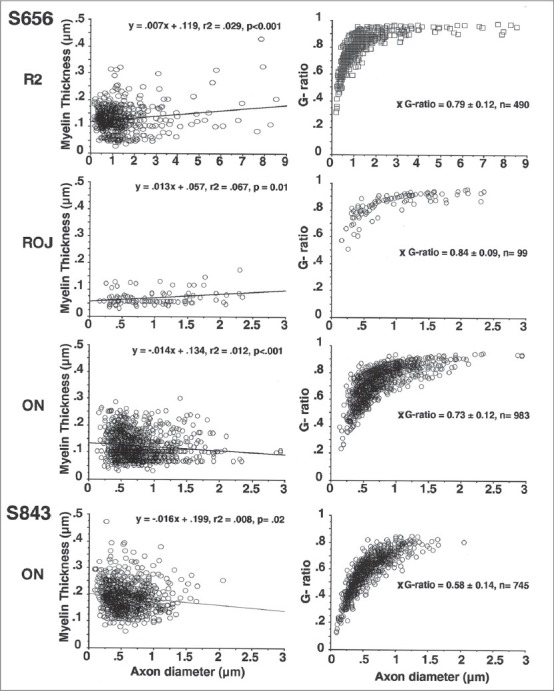
Figure 5.

Myelin thickness versus axon diameter and associated g-ratios. Myelin thickness showed significant correlations to axon diameter for each of the sample locations shown in Figure 4 (S656). In contrast to the retinal sample locations, myelin thickness showed a significant negative correlation in the two optic nerves sampled (S843 represents a normal optic nerve, see also Figure 2). The associated g-ratios are shown for the same sample locations. Note that in the majority of cases g-ratios plateaued at ~0.9
