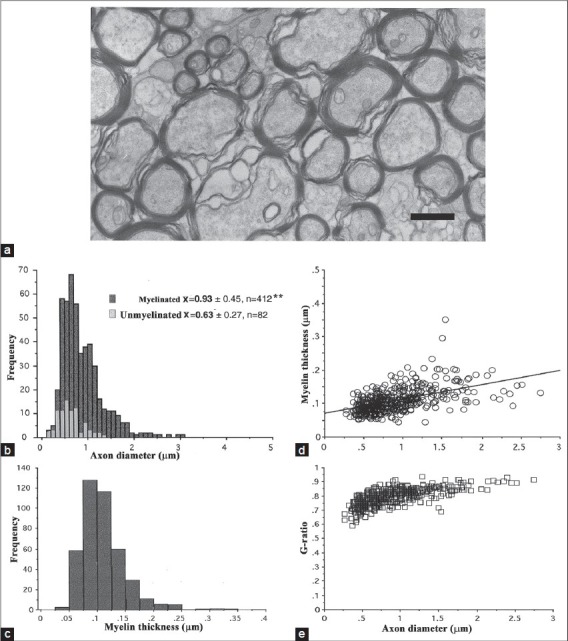
Figure 6.

Comparison data taken from the rabbit retina. (a) Myelinated axons (ax) in the medullary ray (scale bar = 1 μm). (b) Size comparison of unmyelinated and myelinated axons. Note the broader range of axon diameters for myelinated axons. (c) Myelin thickness for the same axons (mean 0.11 ± 0.04 μm, n = 412). (d, e) Axon diameter showed a significant positive correlation with myelin thickness (y = 0.042 + 0.07, r2 =0.272, P = 0.0001) and mean g-ratio of 0.80 (± 0.06, n = 412). Note the narrow range of rabbit g-ratios compared with human data, although the plateau values were very similar
