
Figure 7. Locomotor pattern transformation in DCC KO mice: data and simulations.
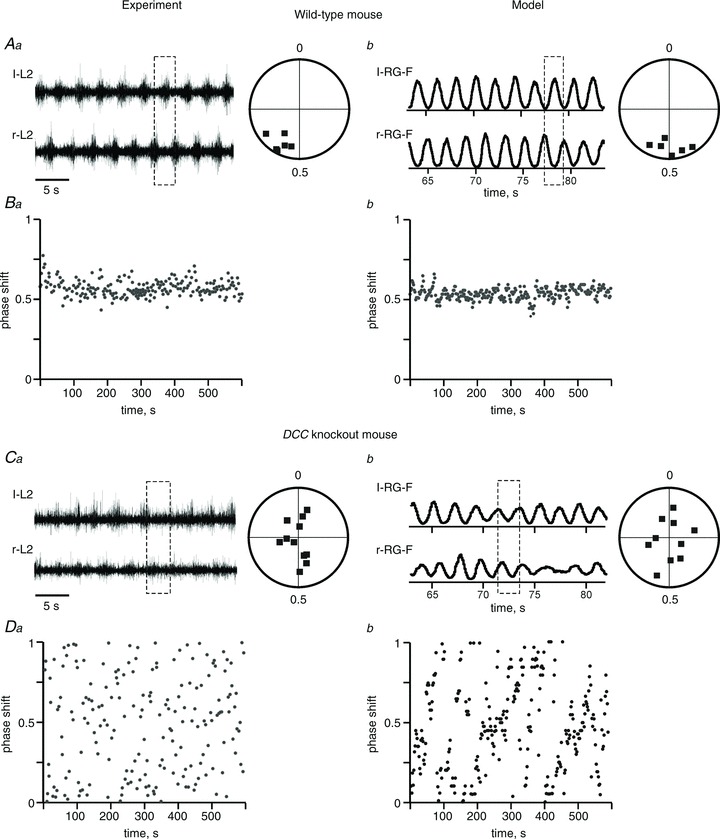
Aa, locomotor-like activity in the isolated spinal cord of a wild-type mouse evoked by the application of NMDA, 5-HT and dopamine. Only records from the left (l-L2) and right ventral roots (r-L2) are shown. Circular phase diagram to the right shows average phase differences between l-L2 and r-L2 activities. Ba, Cartesian representation of the phase differences between l-L2 and r-L2 during 600 s of recording (Aa and Ba are adapted from Rabe Bernhardt et al. 2012, Fig. 1A, B and I, with permission). Ab, integrated activities of l-RG-F and r-RG-F populations produced by the model of intact mouse circuits (Fig. 1A). Circular phase diagram to the right shows average phase differences between activities of r-RG-F and l-RG-F populations in 6 simulations. Similar to Aa, all simulations demonstrate left–right alternation. Bb, Cartesian representation of the phase differences between the activities of r-RG-F and l-RG-F populations during 600 s in a single simulation. Ca and Da, an example of l-L2 and r-L2 recording from the isolated spinal cord of a DCC KO mouse and the corresponding circular and Cartesian phase diagrams showing uncoordinated left and right activities (adapted from Rabe Bernhardt et al. 2012, Fig. 1E, F and L, with permission). Cb and Db, integrated activities of l-RG-F and r-RG-F populations produced by the DCC KO circuit (Fig. 1D). Circular phase diagram to the right (n= 10 simulations) and Cartesian phase diagram (for 600 s of one simulation) show uncoordinated left and right activities similar to Ca and Da. Dashed rectangles indicate left–right alternation or uncoordinated activities.