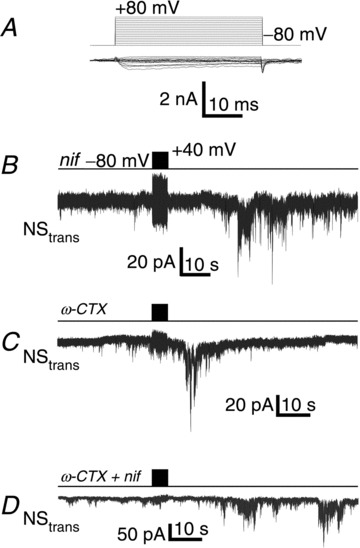
Figure 2. CaV1 and CaV2.2.

A, current trace family for voltage pulses as in Fig. 1B (left panel) in the presence of nifedipine (2 μm) and ω-conotoxin GVIA (2 μm). Mean steady state current amplitudes are plotted against voltage in Fig. 1B (right panel). B, current trace recorded from NStrans while stimulating NScis in the presence of nifedipine (nif) (2 μm) in the bath. C, as in B but with ω-conotoxin GVIA (ω-CTX) (2 μm). D, as in B but with both ω-conotoxin GVIA and nifedipine (ω-CTX + nif).
