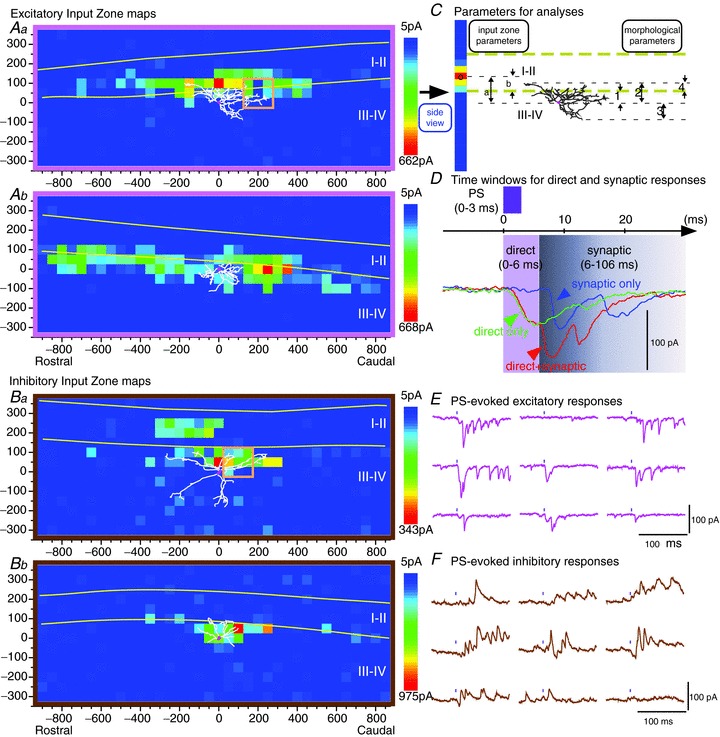
Figure 1. Examples of synaptic input zone maps and photostimulation (PS)-evoked responses of neurons in laminae III–IV, from parasagittal slices.

A, individual maps of excitatory input zones. The map in Aa exhibits a local peak or ‘hot spot’ that is contained within laminae I–II, and so is considered evidence of an input from neuron(s) within laminae I–II. The input zone map in Ab does not have local peaks that are clearly contained within laminae I–II, and so is not considered to constitute clear evidence of an input from laminae I–II neurons; although it extends into laminae I–II, this could be the result of input from presynaptic neurons whose somata are located ventral to the II/III border. Neurons with or without a ‘distinct’ excitatory input (i.e. a local peak in their input zone) from laminae I–II were grouped separately for the averaged maps in Fig. 2. B, individual maps of inhibitory input zones for two neurons. The neuron in Ba is one of the few neurons that received an inhibitory input from laminae I–II. C, diagram of parameters used in analyses. The 3-dimensional map in Aa (x, y, amplitude) is reduced to a single-column 2-dimensional map showing the distribution in the dorsoventral axis, by averaging across all rostrocaudal positions for each dorsoventral position (‘side view’, as in Fig. 1 of Anderson et al. 2010). (Note that a straightening procedure is done on the raw data prior to this averaging to make the laminar borders perfectly horizontal (see Methods). This single-axis distribution is then further reduced to a single position by calculating the weighted mean of the distribution along that axis (marked on the ‘side view’ in this example by a black open circle). This value of weighted mean was then used in subsequent correlation analyses between input zone parameters and morphological parameters. Input zone parameters: dorsoventral position (weighted mean) of the input zone relative to the soma (a) or relative to the lamina II/III border (b). Morphological parameters: 1, distance of soma below II/III border; 2, dorsal, and 3, ventral dendritic extent (relative to soma); 4, dorsal dendritic extent relative to II/III border. D, illustration of time windows for direct and synaptic responses (0–6 ms for direct responses, 6–106 ms for synaptic responses, as determined and validated in Kato et al. 2007, 2009). The amplitude of each event is measured from the level that is present at the onset of that event, not from the pre-stimulus baseline, i.e. it is not summed with the decaying component of a preceding event. Consequently, the presence of a direct response does not add to the measured amplitude of subsequent synaptic responses. E and F, examples of excitatory and inhibitory responses (inward and outward currents) evoked by photostimulation at each of the 9 sites enclosed in the square orange boxes in Aa and Ba, respectively. The black mark above each trace shows the time of the photostimulus. E shows examples of both direct and synaptic responses, but only the synaptic responses are included in the synaptic maps (according to the latency criteria illustrated in D). (These traces show that the responses evoked by the brief 3 ms photostimulus can be fairly prolonged, lasting many tens of milliseconds, as described in our previous studies (Kato et al. 2007). Nonetheless, our previous results, as well as those of previous investigators who have used LSPS, are consistent with the conclusion that the synaptically evoked responses are essentially all monosynaptic, as discussed in Kato et al. (2007, 2009). Their prolonged duration can be attributed to the slow time course of the photostimulation-evoked depolarization, sometimes resulting in the firing of more than one action potential, in the presynaptic neurons (Kato et al. 2007).)
