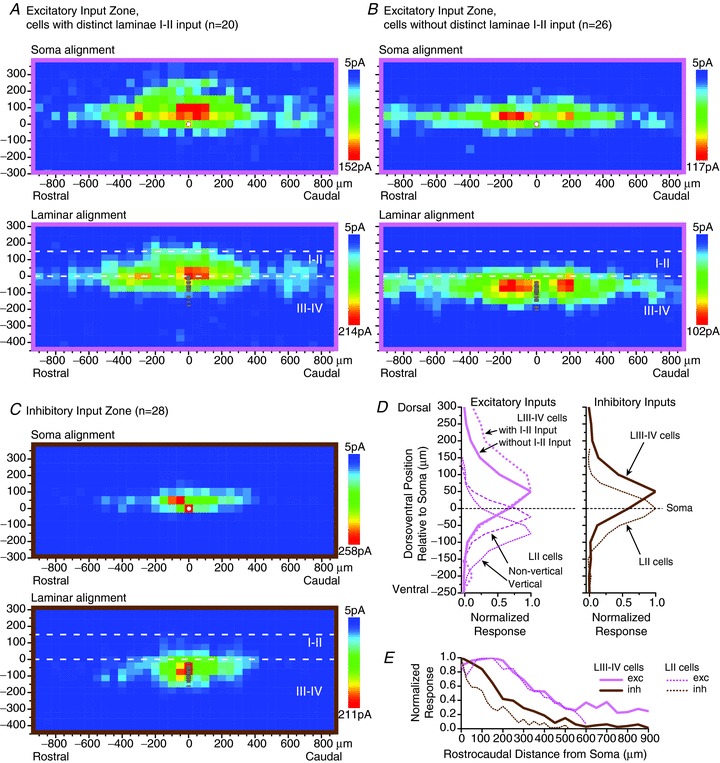
Figure 2.

A–C, averaged parasagittal maps of excitatory (A and B) and inhibitory (C) synaptic input zones for laminae III–IV neurons. For the excitatory input maps, the neuronal sample was divided into neurons with and without a distinct excitatory input zone within laminae I–II (A and B, respectively). For each neuronal sample, separate averaged maps are shown in which the individual maps were aligned dorsoventrally either by soma position or by laminar borders (upper and lower maps, respectively, in A–C). The soma position of each of the neurons in the sample is marked by individual circles in the laminar-aligned maps, and is marked by a single white circle in the soma-aligned maps. D and E, plots of the dorsoventral (D) and rostrocaudal (E) distribution of the synaptic input zones relative to the neuron's soma for the laminae III–IV neurons, shown alongside the same plots for lamina II neurons from data of Kato et al. (2009). In D, separate plots are shown for the excitatory inputs to lamina II vertical and non-vertical cells (islet, central, radial and unclassified cells). (Note that ‘exc’ and ‘inh’ in E refer to the sign of the synaptic inputs, not the identity of the postsynaptic neurons.)
