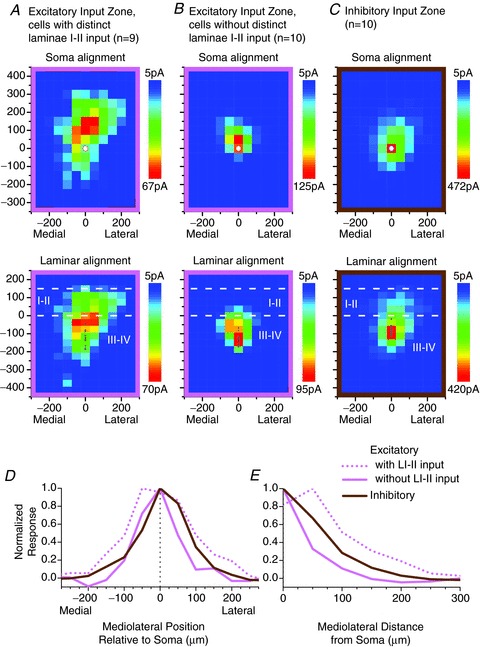
Figure 6.

A–C, averaged transverse maps of excitatory (A and B) and inhibitory (C) synaptic input zones for laminae III–IV neurons. Details as in Fig. 2A–C. D and E, plots of the mediolateral distribution of the input zones, shown as mediolateral position (D) or mediolateral distance (E) relative to the soma. Mediolateral distance is the absolute value of mediolateral position.
