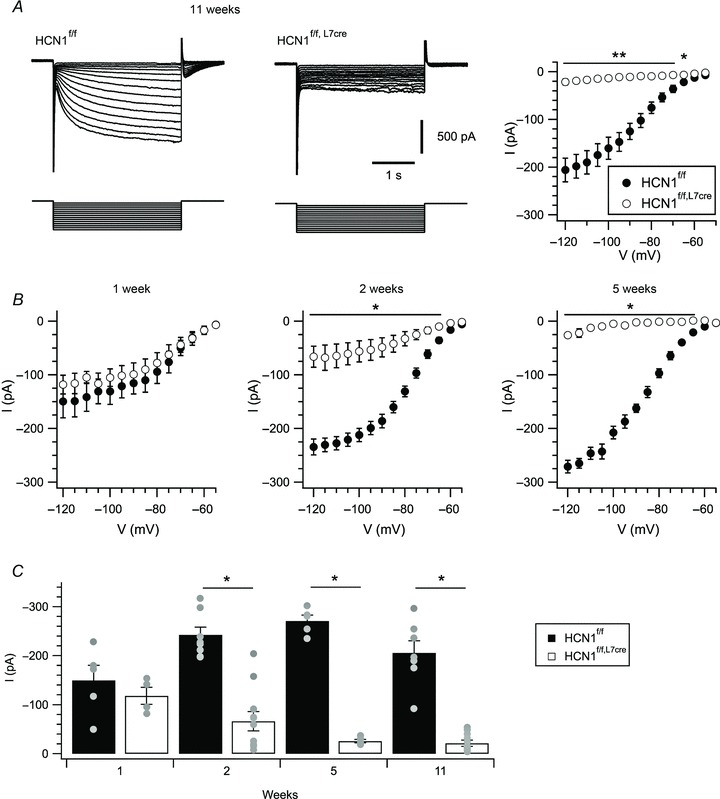
Figure 1. Postnatal reduction of Ih in Purkinje cells from HCN1f/f,L7Cre mice.

A, hyperpolarization to voltages between −55 mV and −120 mV in 5 mV increments from a holding potential of −50 mV (lower traces) activates a prominent Ih in HCN1f/f mice (upper left), while in HCN1f/f,L7Cre mice Ih is absent (upper middle). Tail currents measured upon return to −50 mV, plotted as a function of the preceding test potential (right), quantify reduction of Ih in HCN1f/f,L7Cre (n= 11) compared to HCN1f/f (n= 7) mice (genotype X test potential F13,208= 66.9, P= 0.02, two-way ANOVA). B, mean tail current amplitude plotted as a function of test potential for Purkinje cells from 1 (genotype X test potential F1,13= 0.89, P= 0.57, n= 4–5/group, two-way ANOVA), 2 (F13,23= 35.99, P < 0.0001, n= 9–11/group) and 5 week-old HCN1f/f and HCN1f/f,L7Cre mice (F13,104= 166.81, P < 0.0001, n= 5/group). C, tail currents measured following a test step to −120 mV are plotted as a function of age of the mouse (genotype X age F3,50= 8.06, P < 0.0001, two-way ANOVA). Grey circles represent individual cells. Data are presented as mean ± SEM; *P < 0.05, **P < 0.001 HCN1f/fversus HCN1f/f,L7Cre, Fisher's PLSD.
