
Figure 4. HCN1 channels in Purkinje cells are important for integration of visual-vestibular inputs during later stages of learning.
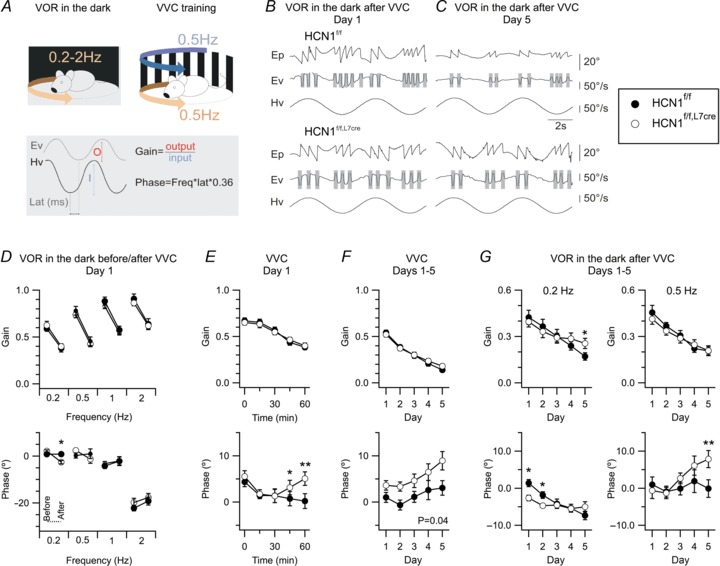
A, illustration of the training paradigm (top) and gain and phase calculations based on head (Hv) and eye (Ev) velocity measurements. B and C, example traces of 0.2 Hz VOR in the dark, with amplitude of rotation ∼80°, recorded from HCN1f/f (top) and HCN1f/f,L7Cre (bottom) mice after the first (B) and last (C) VVC training session. Each panel shows eye position (Ep), Ev and corresponding Hv. Shaded areas represent segments of data removed from the analysis because they contained saccades. D, gain (upper) and phase (lower) of the VOR in the dark, plotted as a function of rotation frequency. VOR phase at 0.2 Hz following VVC was reduced in HCN1f/f,L7Cre mice compared to HCN1f/f (genotype X trial F1,23= 13.89, P= 0.001, n= 10–15, two-way ANOVA). There was no other significant difference (P > 0.1; see Supplementary Data). E and F, mean gain (upper) and phase (lower) during VVC are plotted as a function of time during the first day (E) and as a function of day (F). HCN1f/f (n= 11) and HCN1f/f,L7Cre (n= 13) mice showed a comparable gain decrease on day 1 (genotype X time F4,88= 0.86, P= 0.49, two-way ANOVA), but a significant difference developed in the phase (F4,88= 3.33, P= 0.01). Gain was similar in HCN1f/f (n= 10) and HCN1f/f,L7Cre mice (n= 15) (genotype X day F4,92= 1.78, P= 0.14, two-way ANOVA), while the phase difference was maintained across consecutive training days (genotype F1,23= 4.66, P= 0.04). G, VOR gain adaptation was reduced by HCN1 deletion at the lowest frequency tested (genotype X day F4,72= 3.05, P= 0.02, two-way ANOVA) but not at other frequencies (P > 0.1; see Supplementary Data), while phase adaptation was modified at 0.2 Hz (genotype X day F4,72= 3.67, P= 0.009) and 0.5 Hz (F4,84= 3, P= 0.03). Data are presented as mean ± SEM; *P < 0.05, **P < 0.001 HCN1f/fversus HCN1f/f,L7Cre, Fisher's PLSD.